This page presents the full list of sheets available in Data AnalyTix. Depending on the activated verticals, only a sub-set of sheets may be available. The sheets of the GENERAL section are available in all verticals.
GENERAL
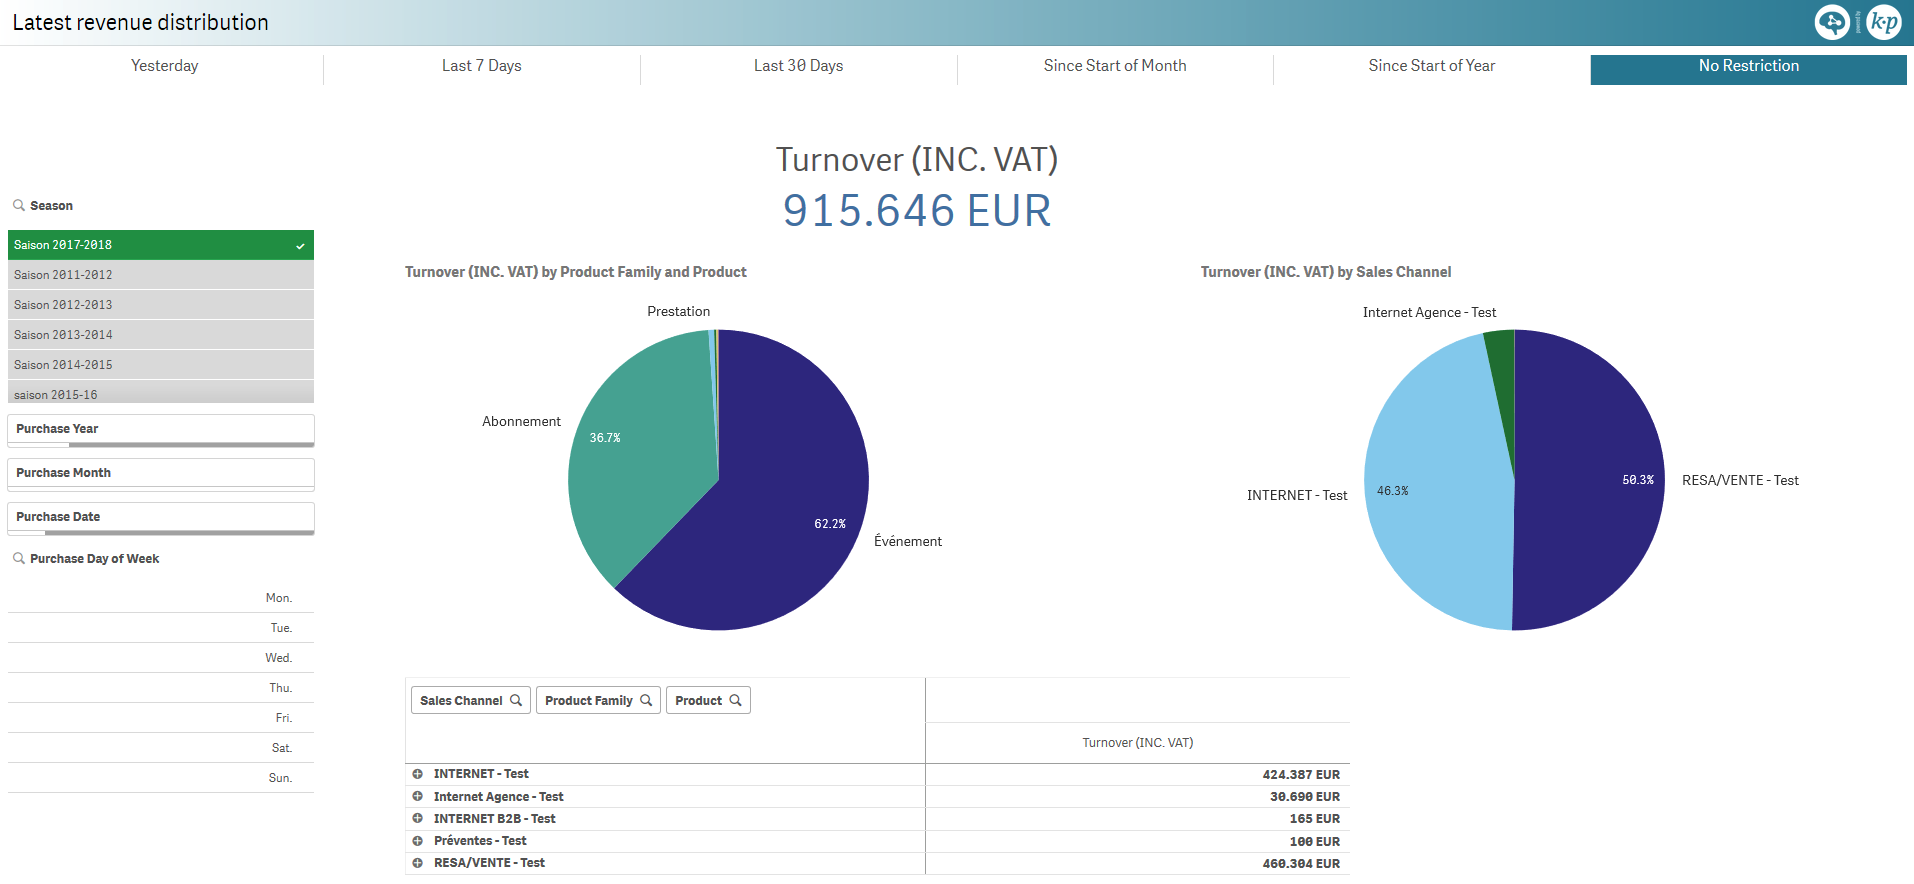
Latest revenue distribution [G]
Latest revenue distributed per product family, sales channel and product.
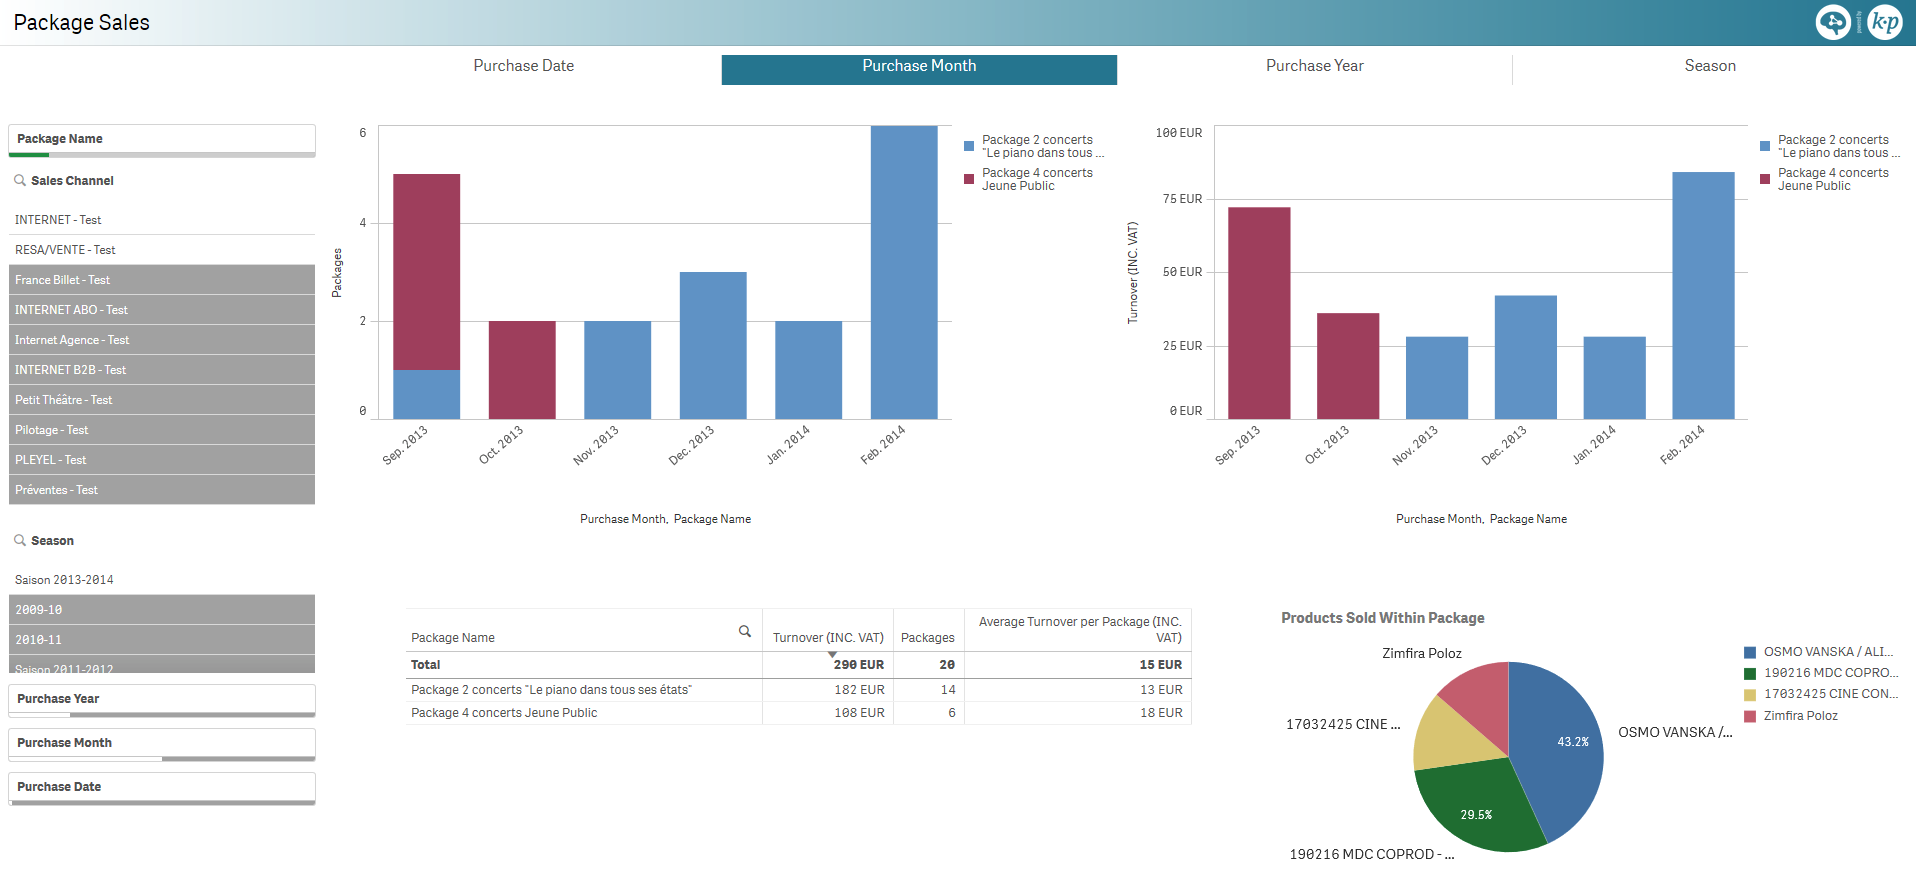
Package Sales [G]
Number of packages sold and revenue from packages distributed either over the following dimension, split by package:
- Purchase date
- Purchase month
- Purchase year
- Season
Distribution of the products sold within a package.
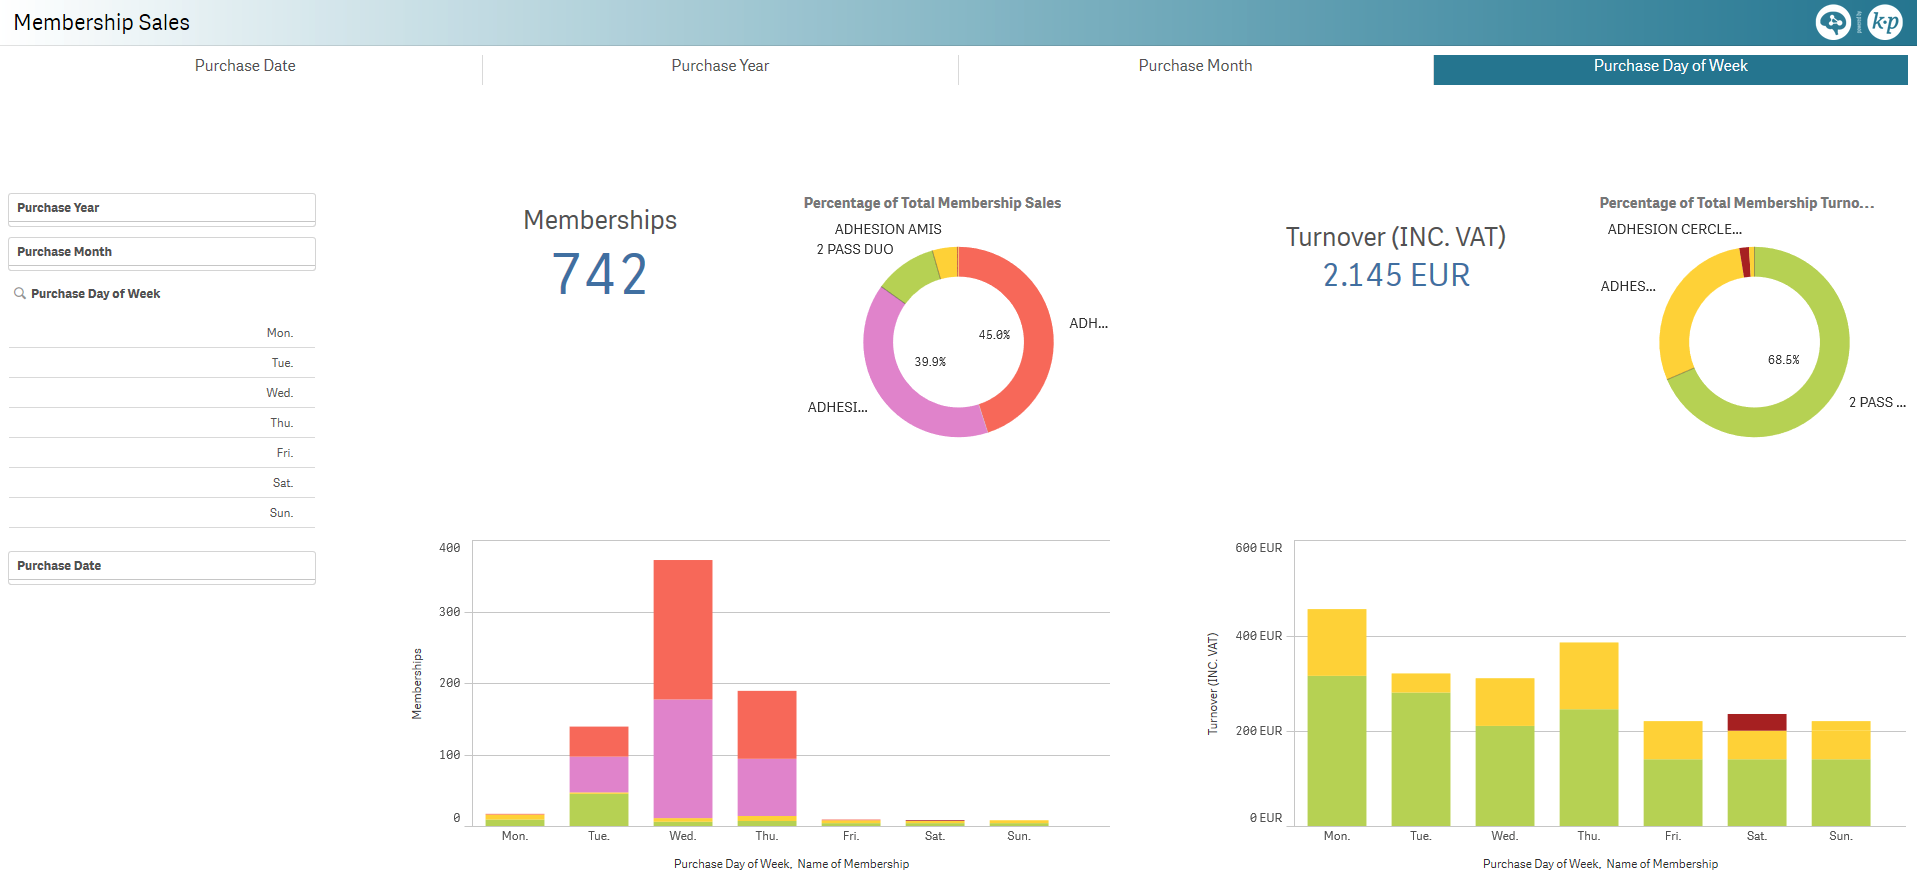
Membership Sales [G]
Total number of memberships sold and revenue from memberships.
Percentage of number of memberships and percentage of revenue from memberships per membership.
Number of memberships sold and revenue from memberships distributed either over the following dimension, split by membership:
- Purchase date
- Purchase year
- Purchase month
- Purchase day of the week
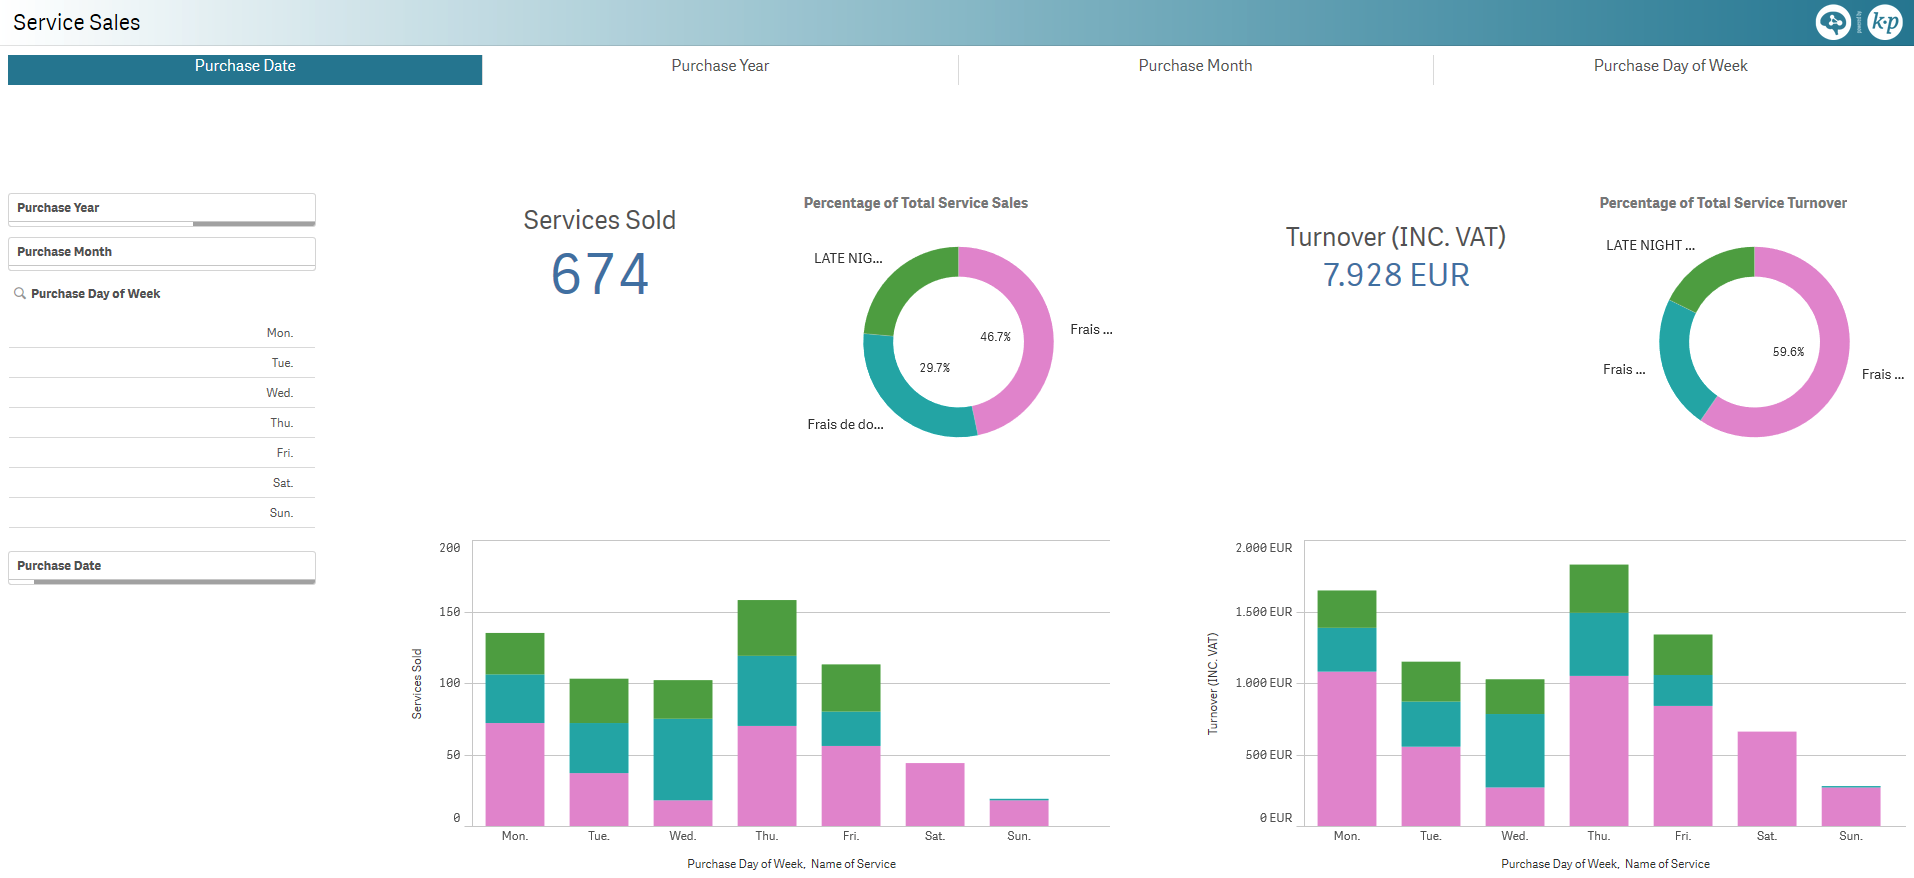
Service Sales [G]
Total number of services sold and revenue from services.
Percentage of number of services and percentage of revenue from services per service.
Number of services sold and revenue from services distributed either over the following dimension, split by service:
- Purchase date
- Purchase year
- Purchase month
- Purchase day of the week
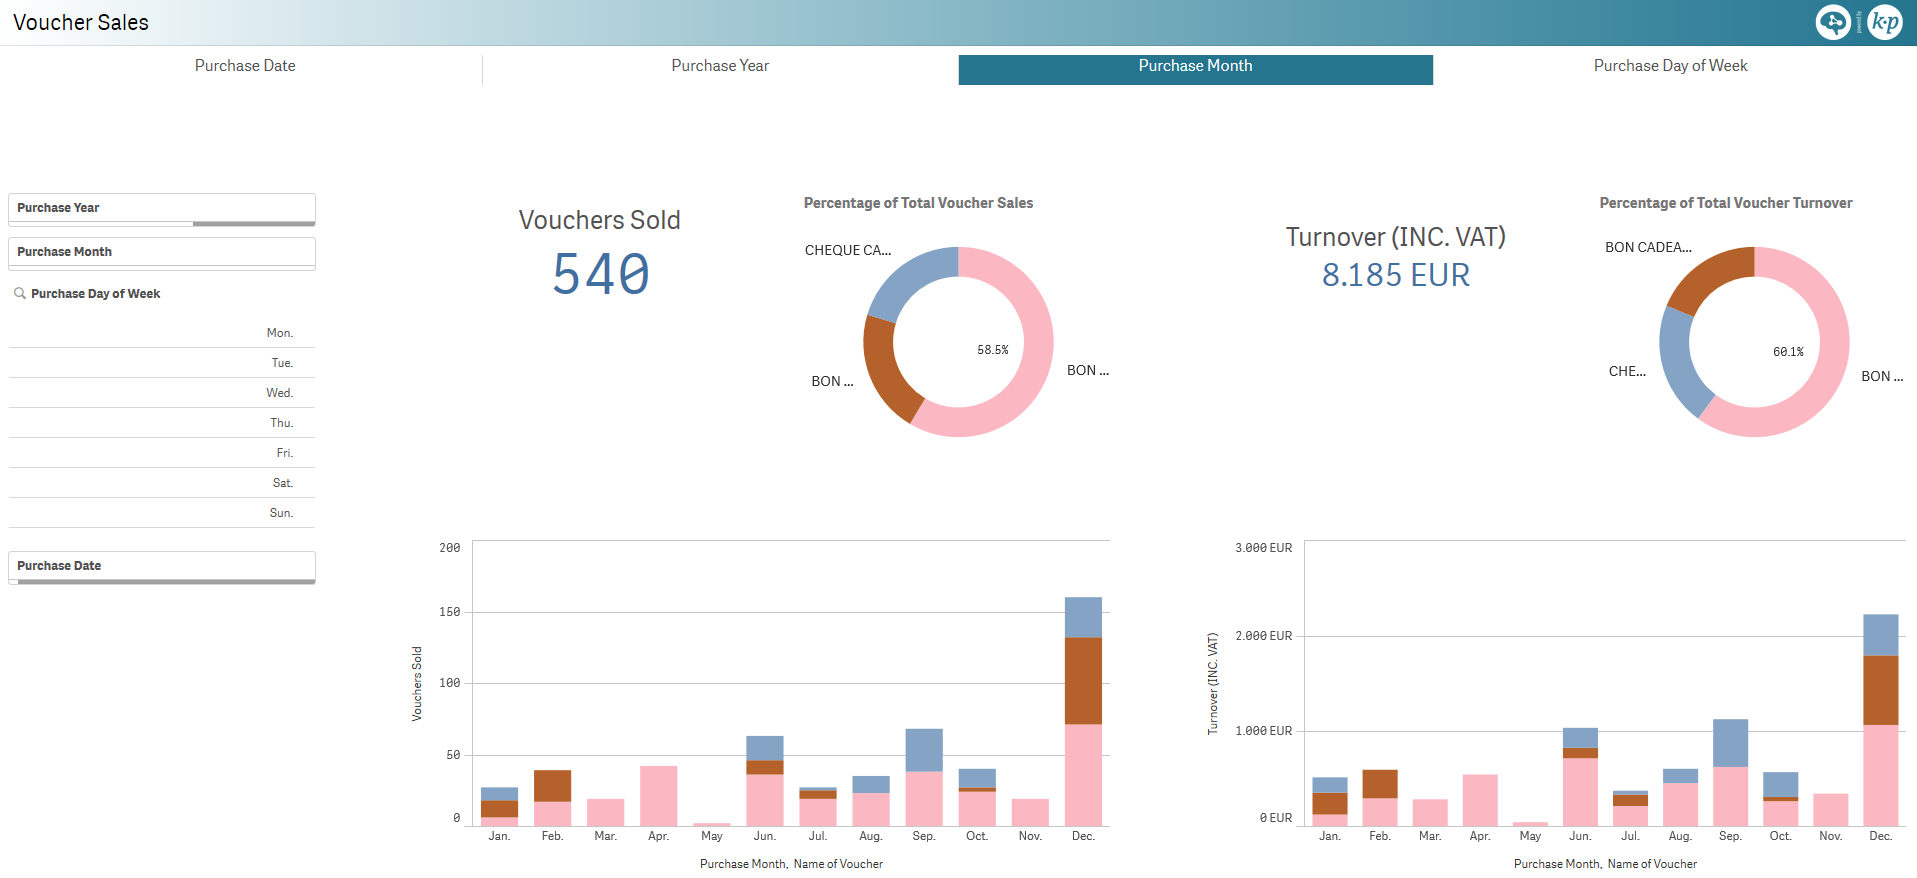
Voucher Sales [G]
Total number of vouchers sold and revenue from vouchers.
Percentage of number of vouchers and percentage of revenue from vouchers per voucher.
Number of vouchers sold and revenue from vouchers distributed either over the following dimension, split by voucher:
- Purchase date
- Purchase year
- Purchase month
- Purchase day of the week
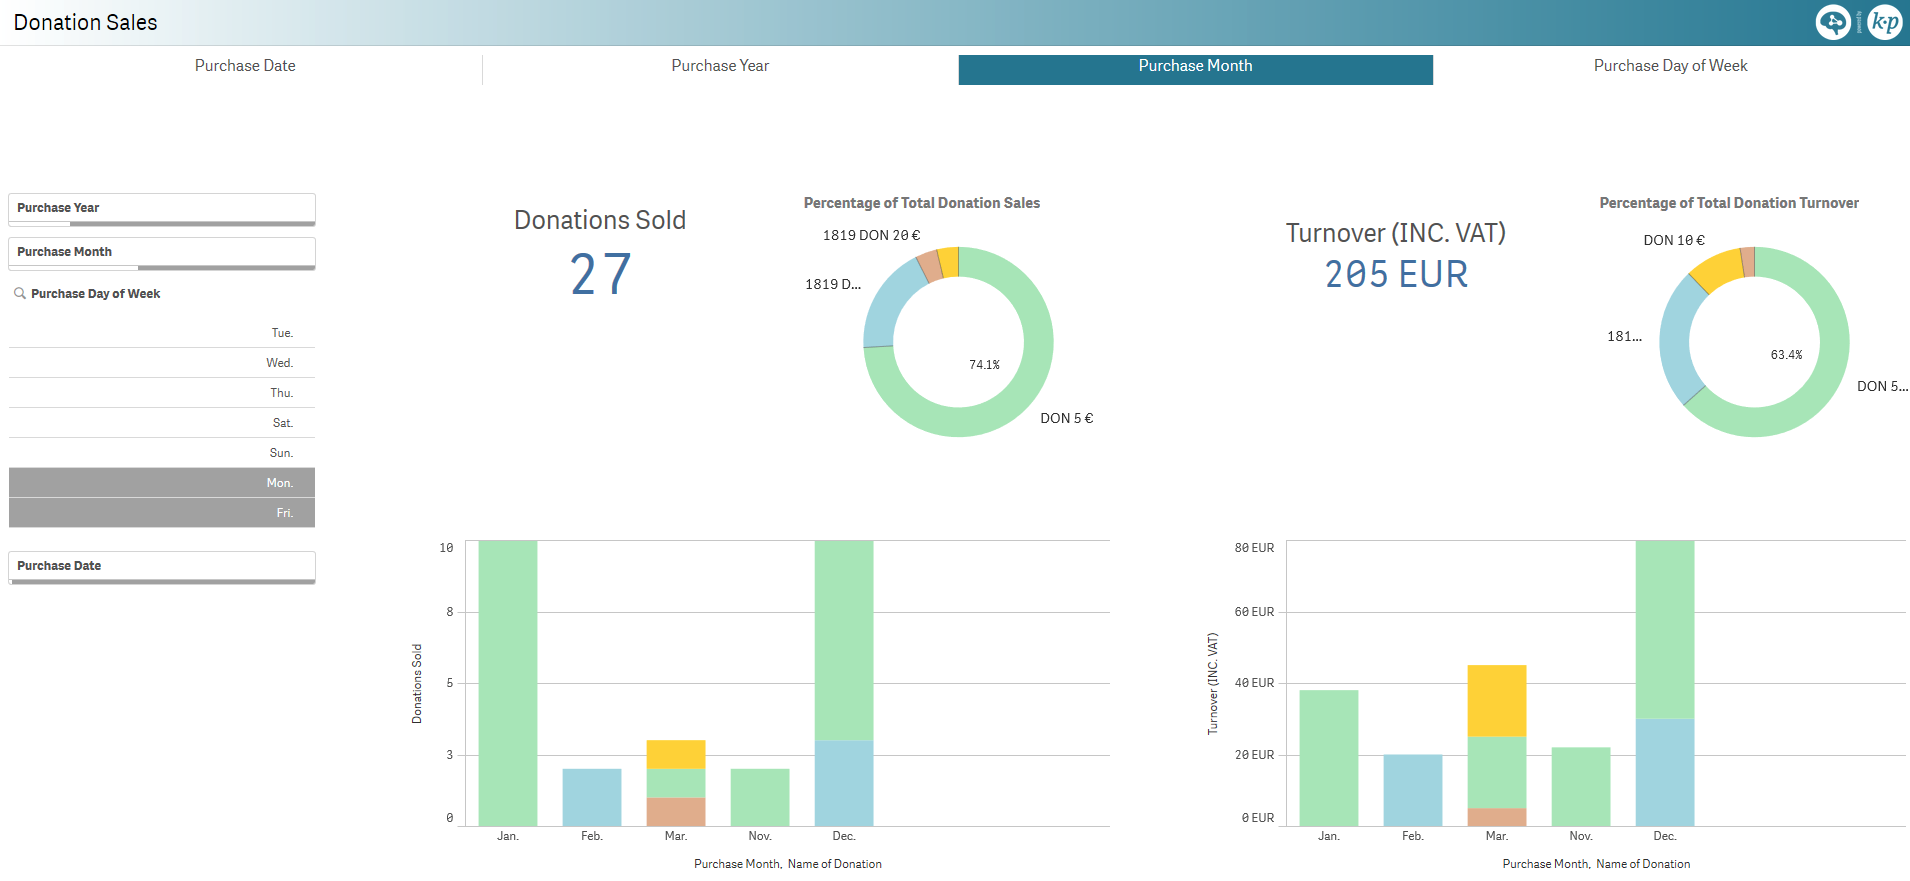
Donation Sales [G]
Total number of donations sold and revenue from donations.
Percentage of number of donations and percentage of revenue from donations per donation.
Number of donations sold and revenue from donations distributed either over the following dimension, split by donation:
- Purchase date
- Purchase year
- Purchase month
- Purchase day of the week
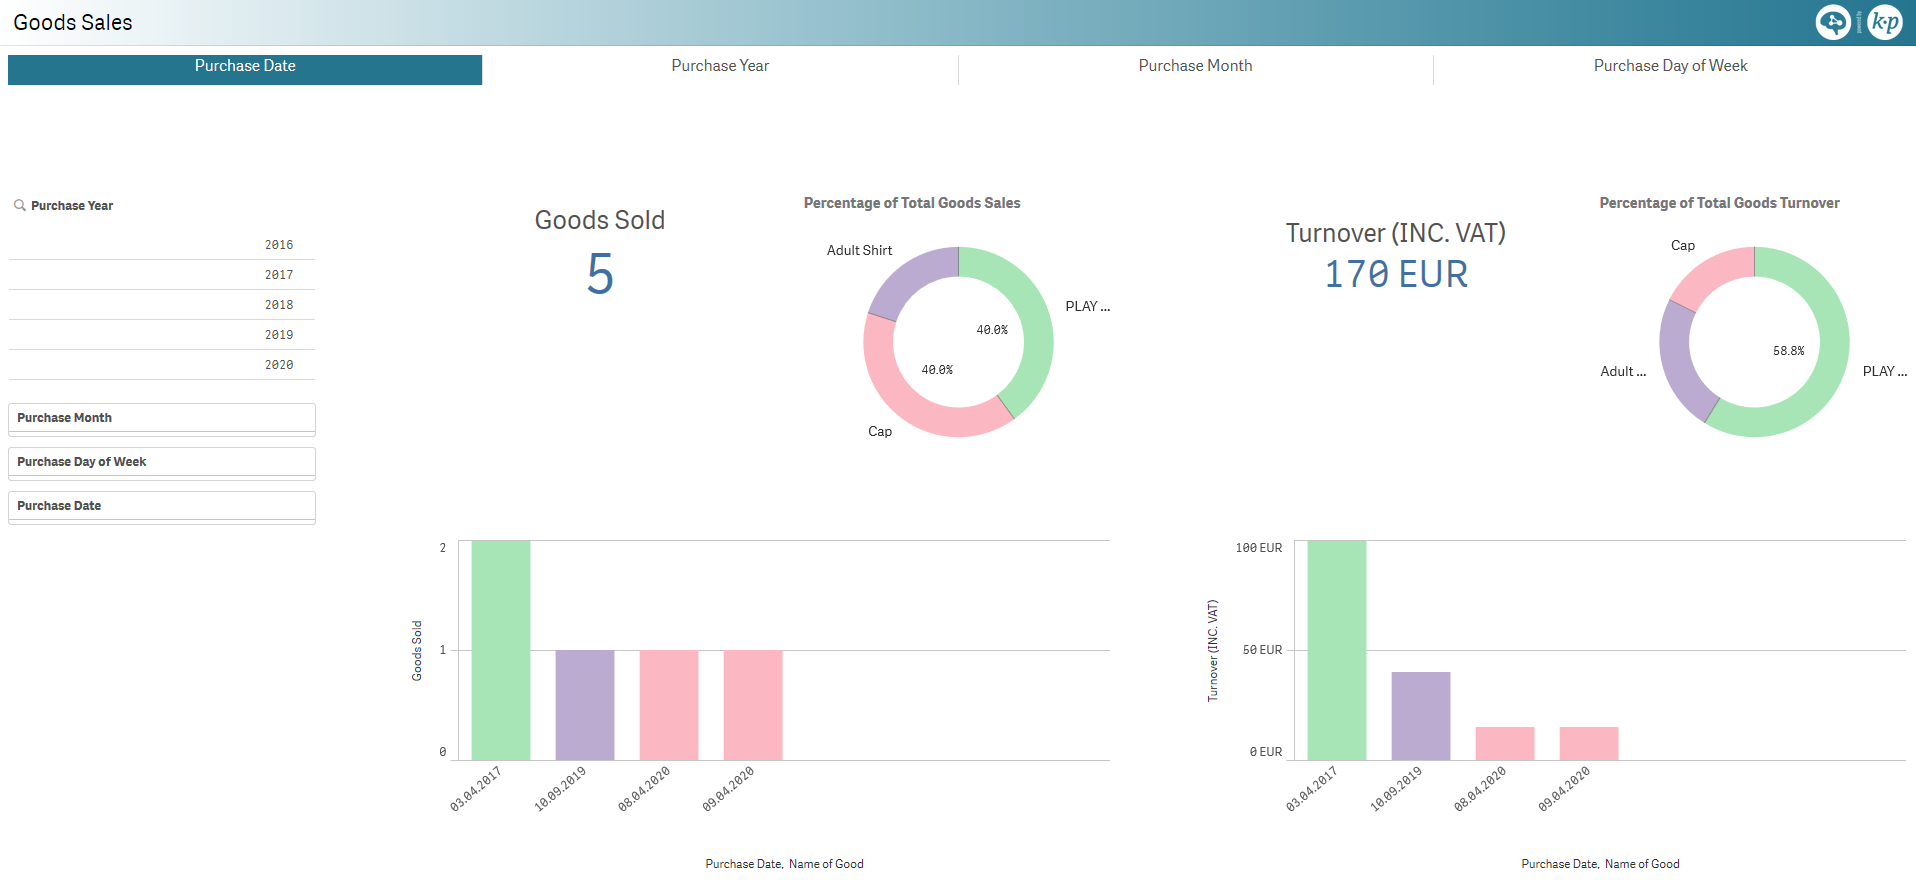
Goods Sales [G]
Total number of goods sold and revenue from goods.
Percentage of number of goods and percentage of revenue from goods per good.
Number of goods sold and revenue from goods distributed either over the following dimension, split by good:
- Purchase date
- Purchase year
- Purchase month
- Purchase day of the week
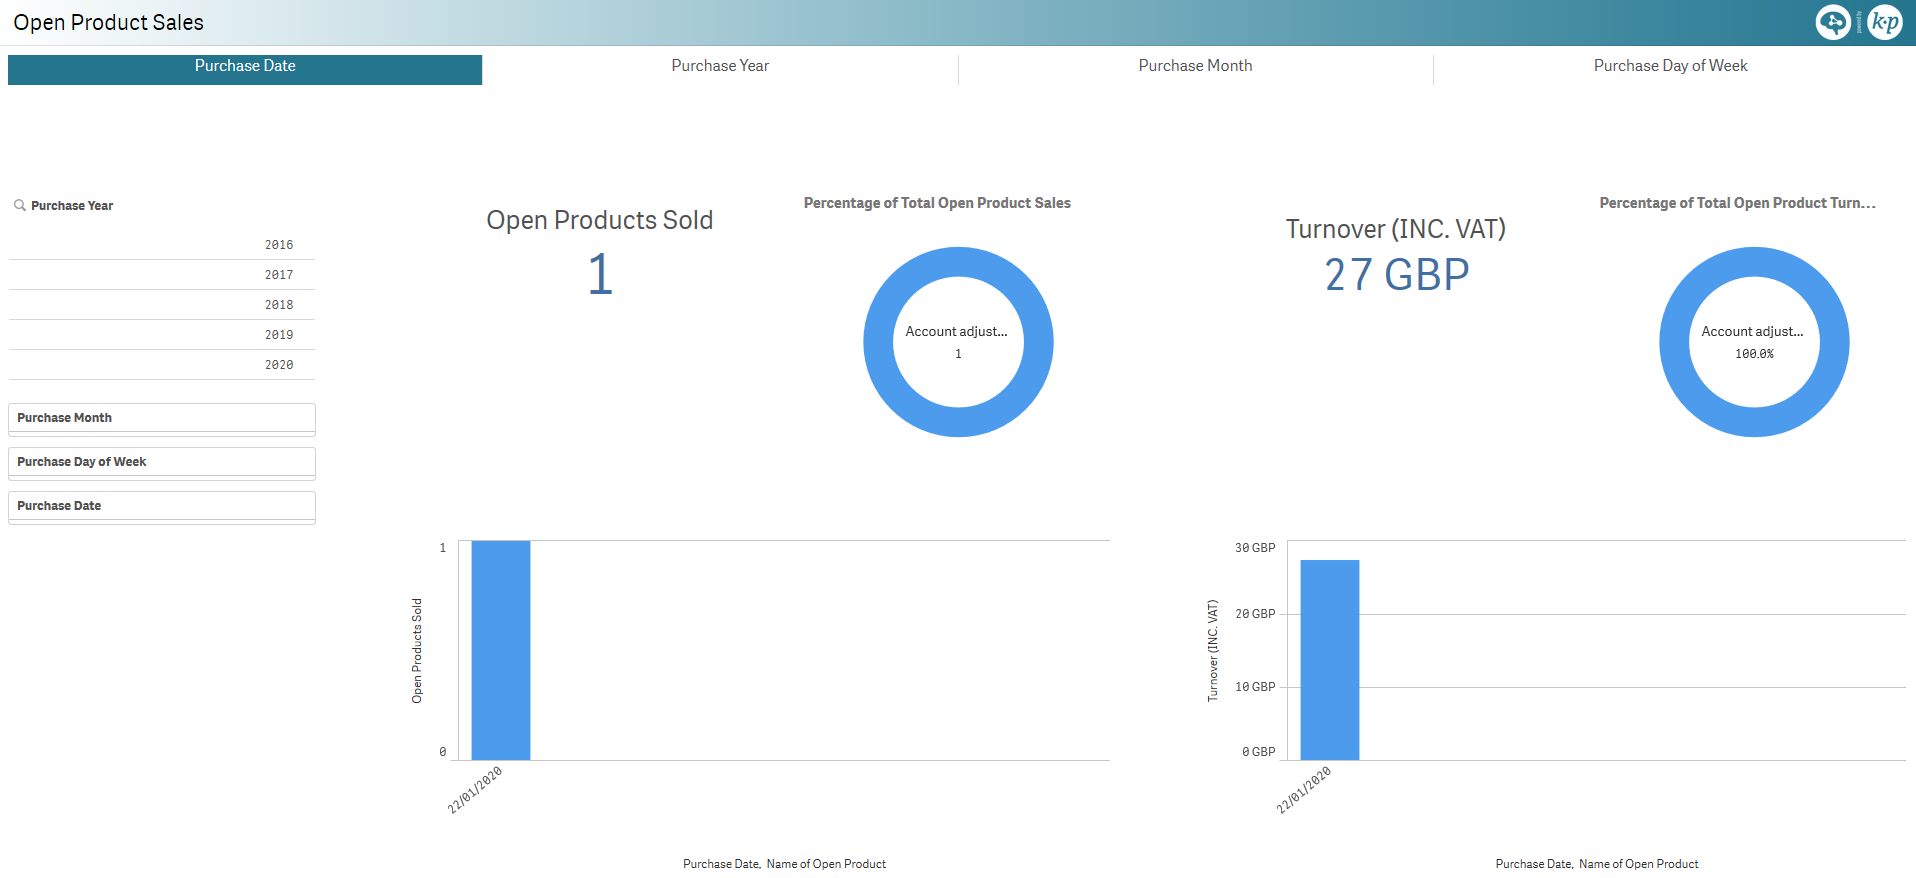
Open Product Sales [G]
Total number of open products sold and revenue from open products.
Percentage of number of open products and percentage of revenue from open products per open product.
Number of open products sold and revenue from open products distributed either over the following dimension, split by open product:
- Purchase date
- Purchase year
- Purchase month
- Purchase day of the week
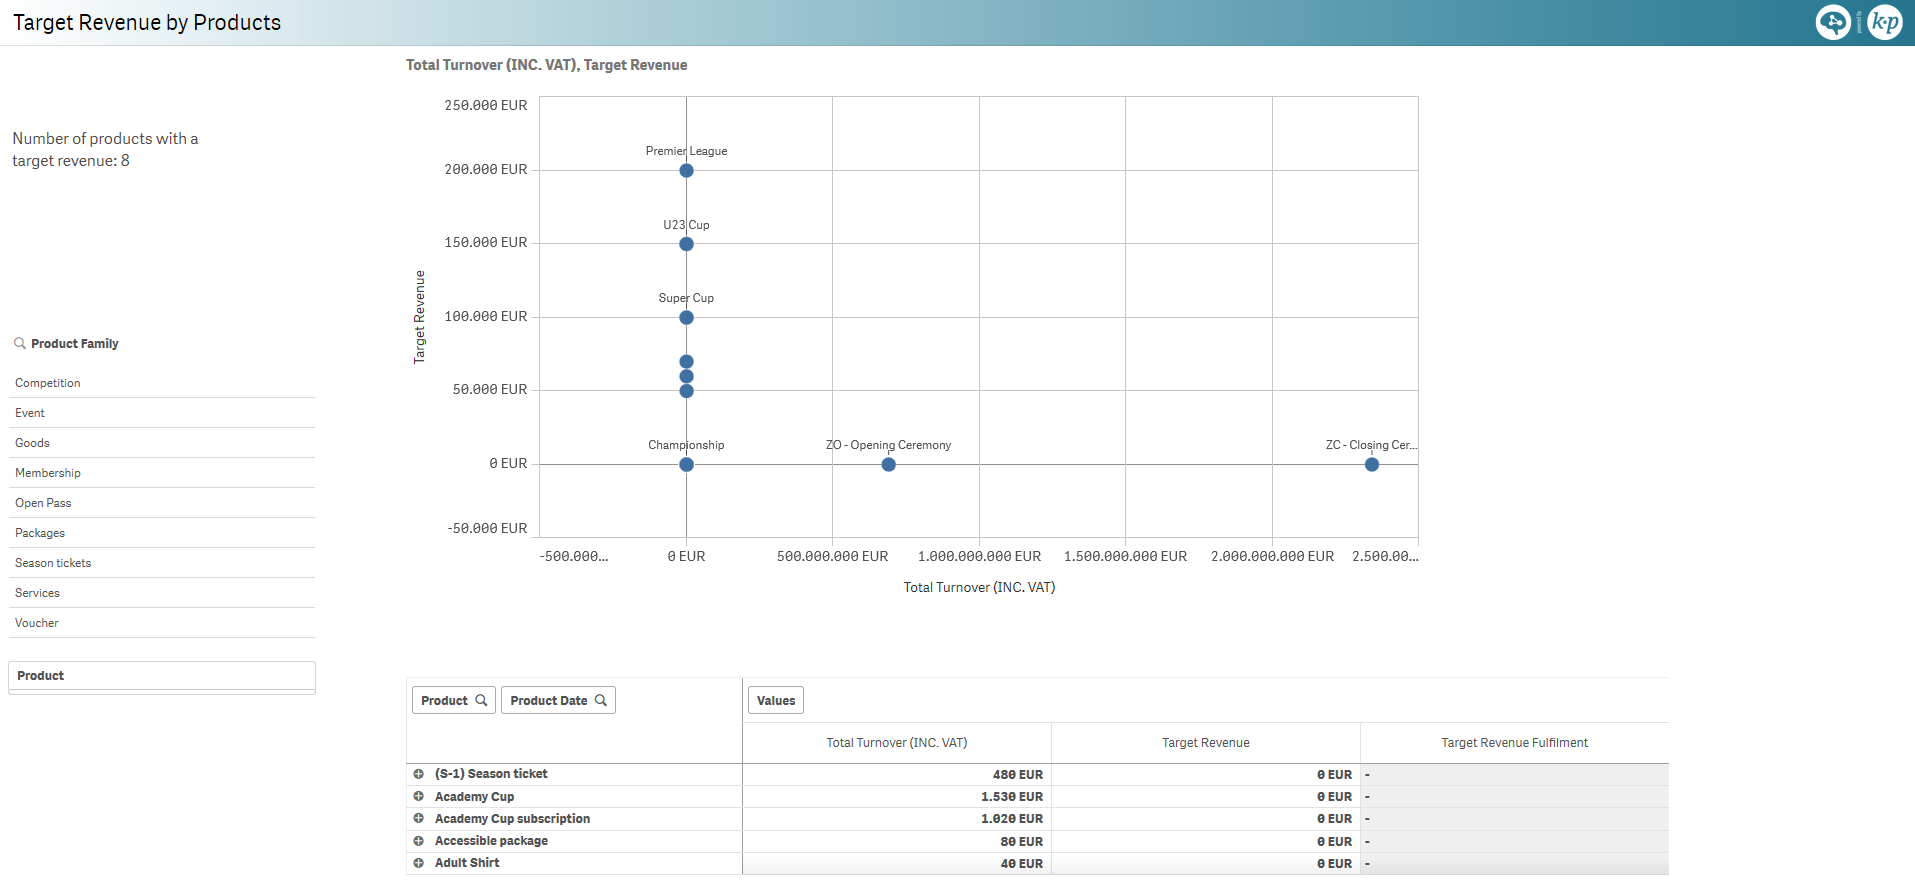
Revenue utilization per product [G]
Scatter plot of the revenue and target revenue of each product.
Note: target revenues can be defined in the catalogue module of SecuTix, see here for more details.
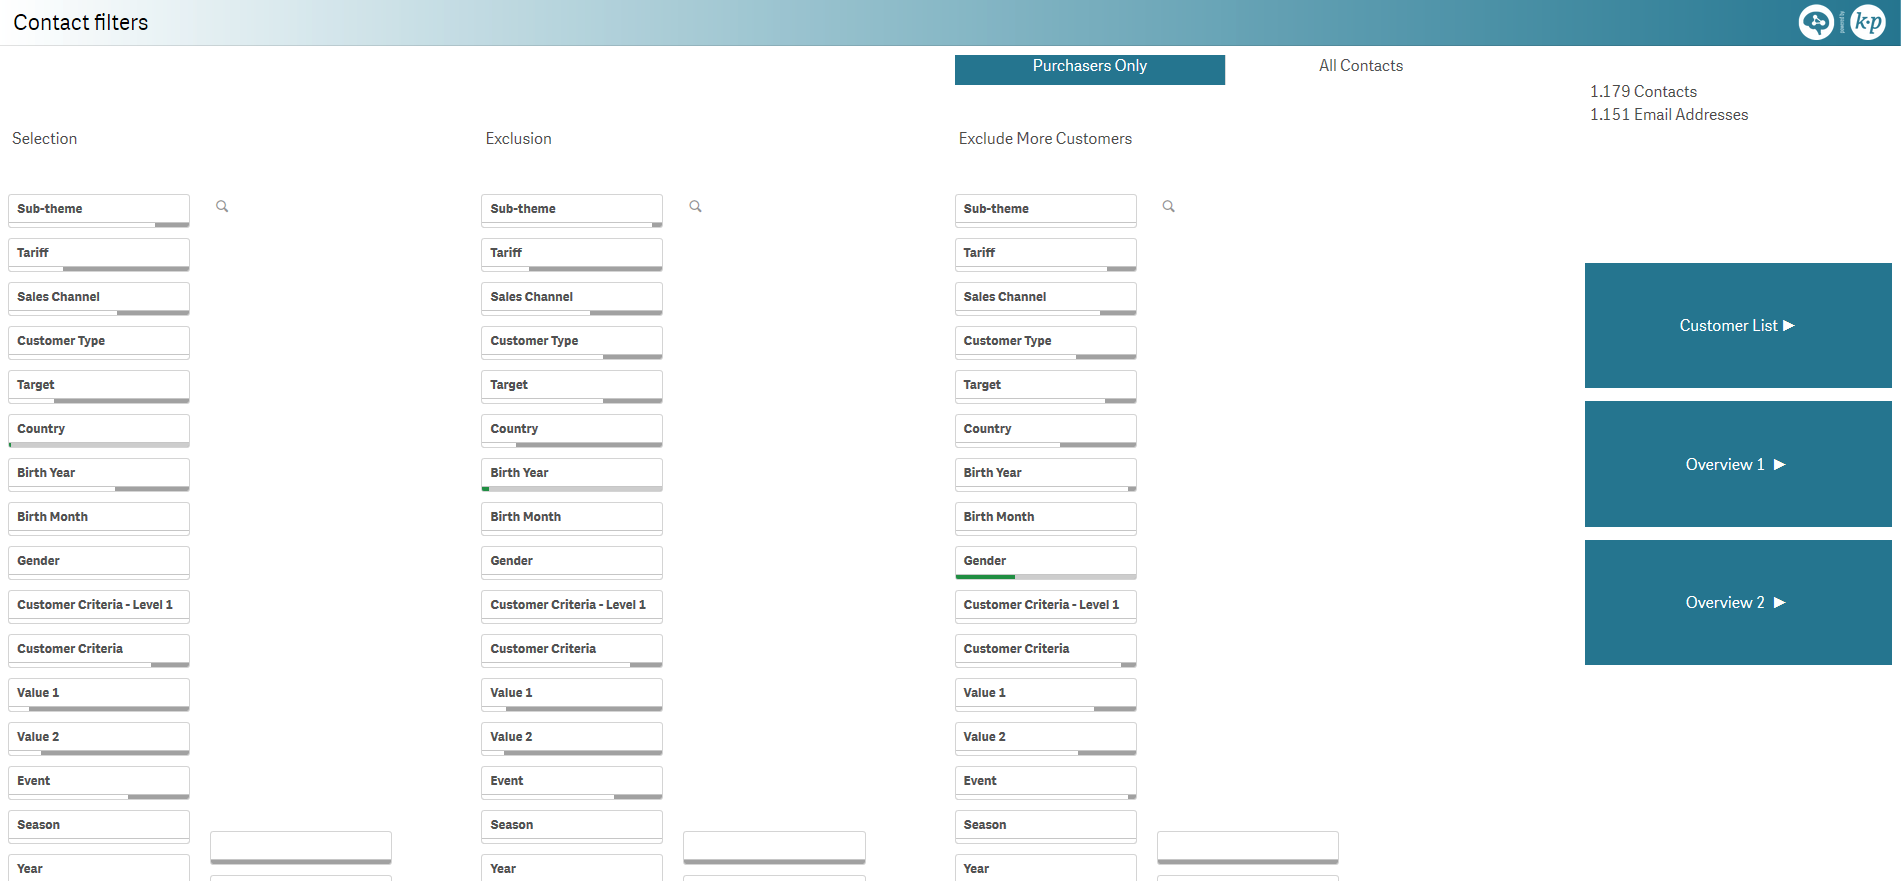
Contact filters [G]
Number of filtered purchasers and total contacts, which also includes contacts with cancellations.
This advanced contact filtering sheet allows you to achieve more complex filtering cases.
For example, if we take the following sets of customers:
- Swiss customers
- Millennials (those born after 1999)
- Customers having purchased this year
It possible to find the Swiss customers, excluding the millennials and also excluding those having purchased this year, i.e., A - (B U C), which is different than the Swiss customers, excluding the millennials having purchased this year, i.e., A - (B ∩ C).
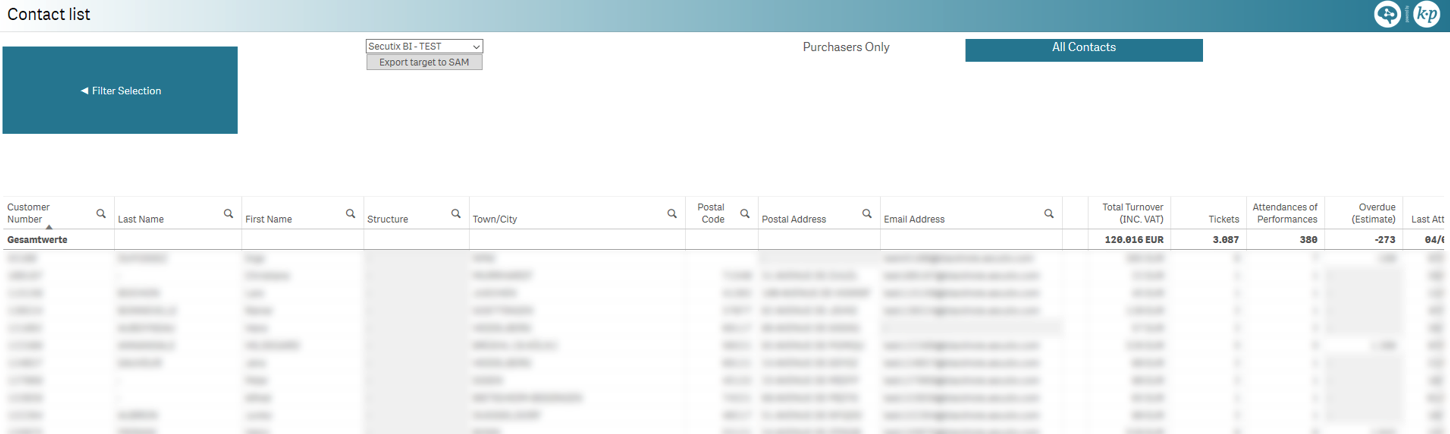
Contact list [G]
List of contacts including the following information:
- Contact number
- Last name
- First name
- Structure name
- City (of residence)
- Postal code
- Postal address
- Email address
- Total revenue
- Ticket sold (Museum)
- Ticket sold (Live Entertainment)
- Attendance of performances
- Overdue (estimated), i.e., attendance overdue in days
- Last attendance
- Next anticipated attendance
- Interval since last attendance
- Attendance frequency
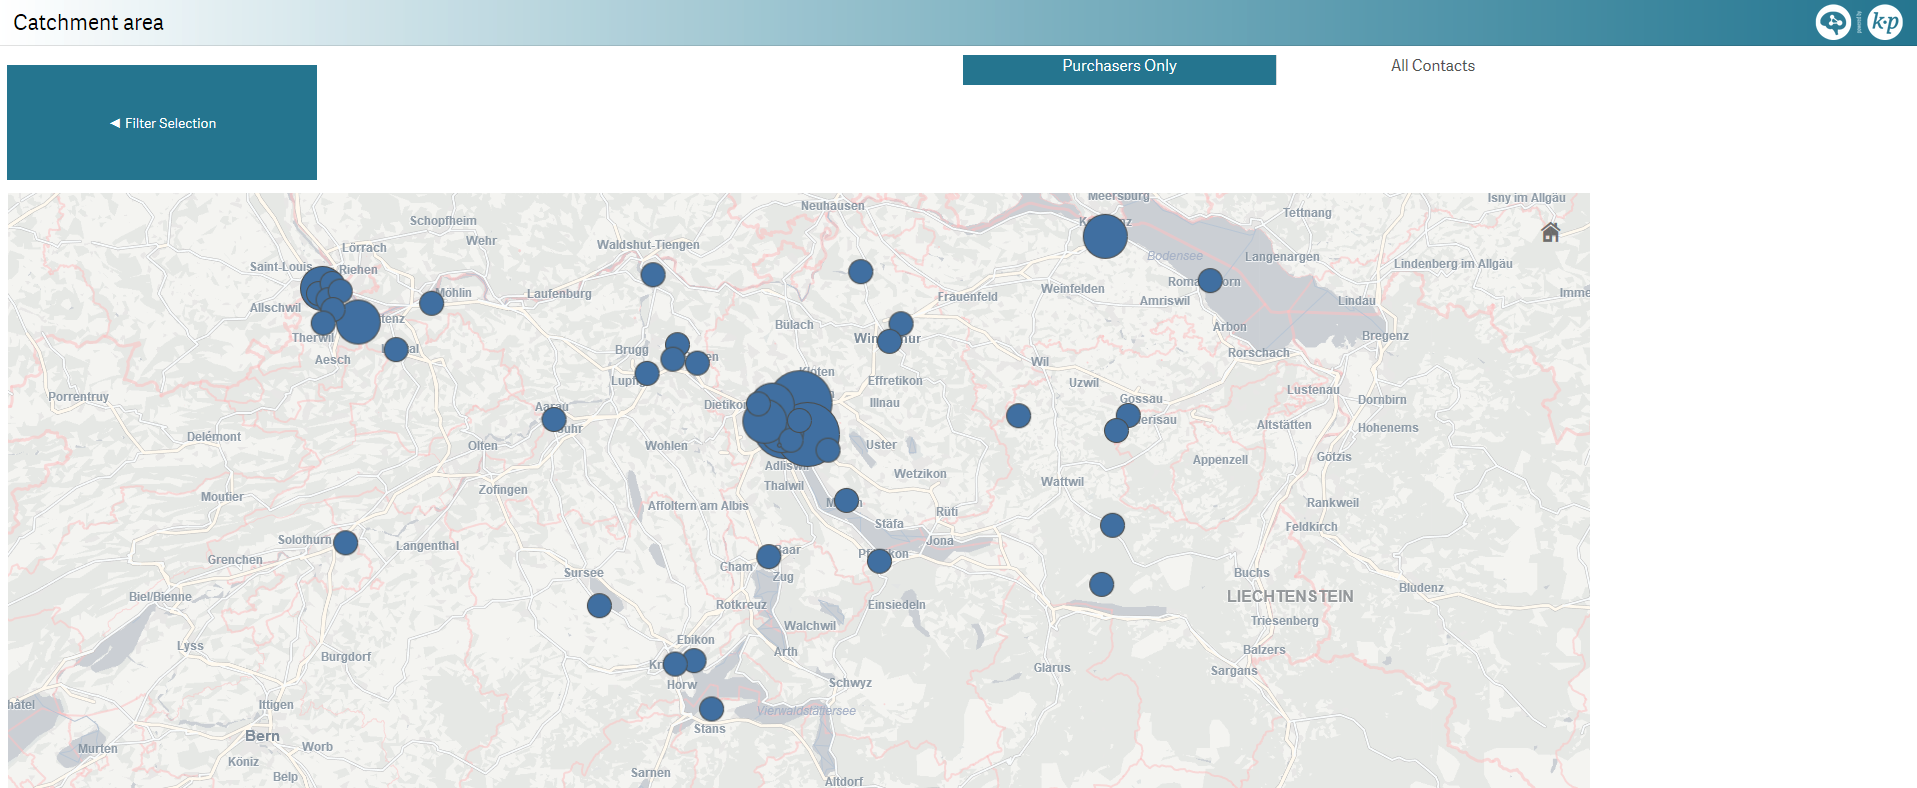
Catchment area [G]
Geographical map view of the number of contacts per postal code.
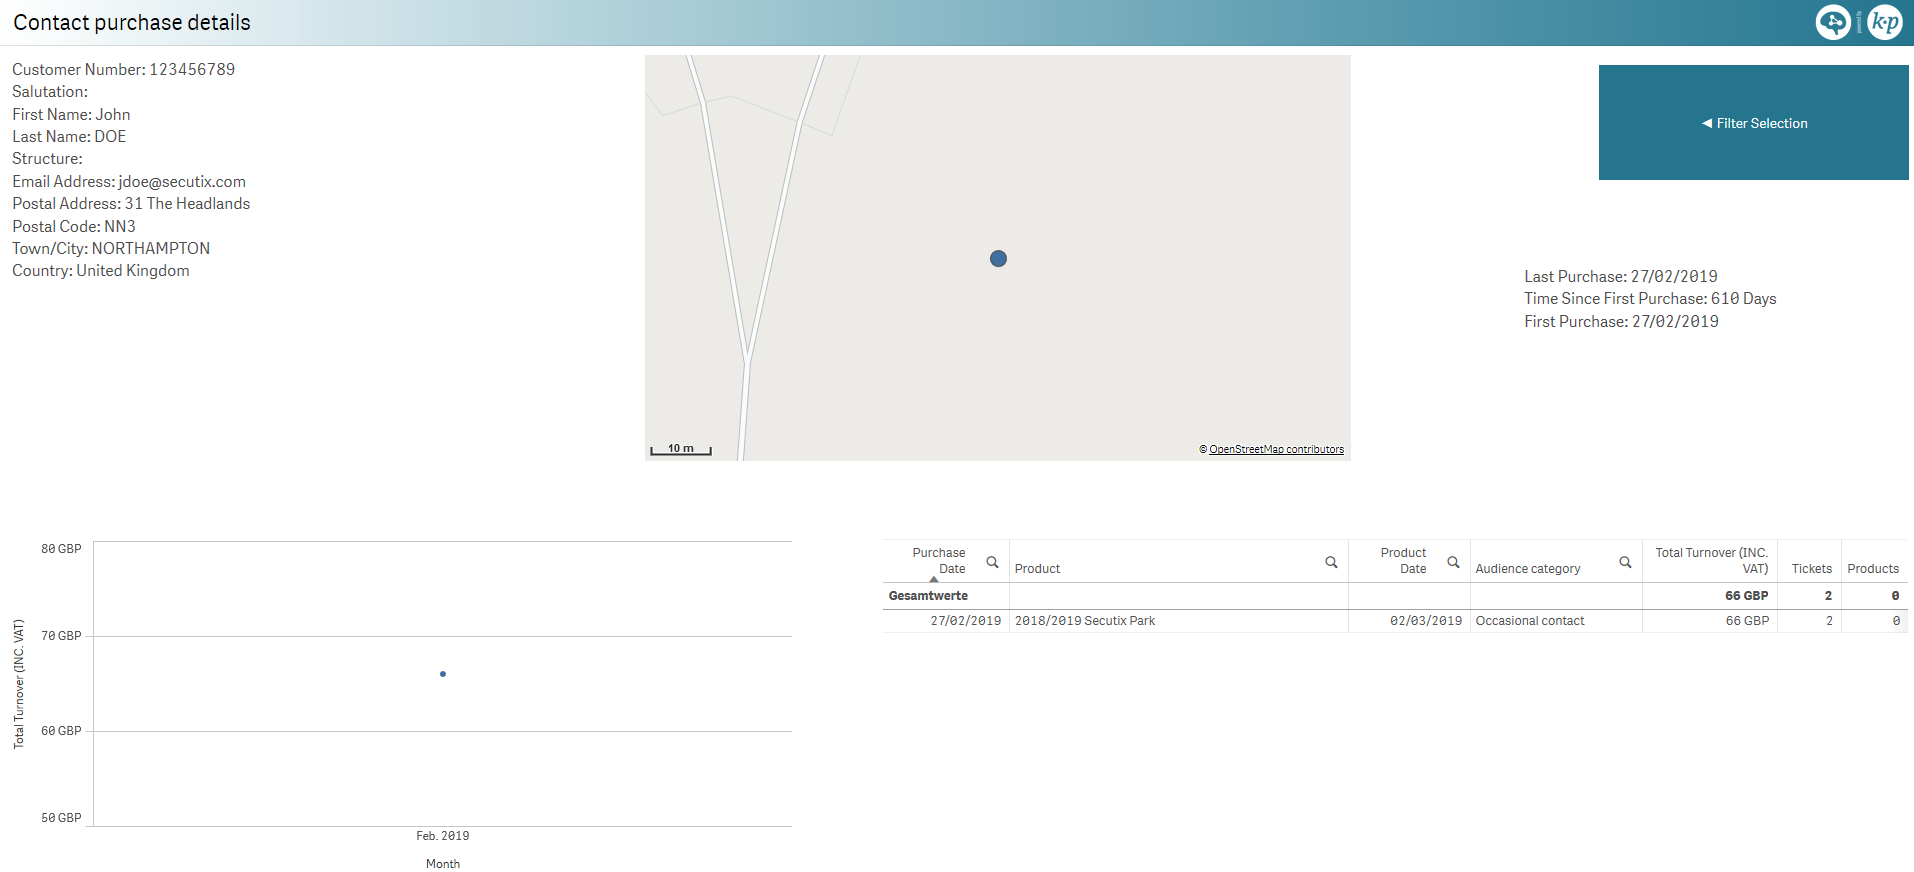
Contact purchase details [G]
Detailed view for a single contact.
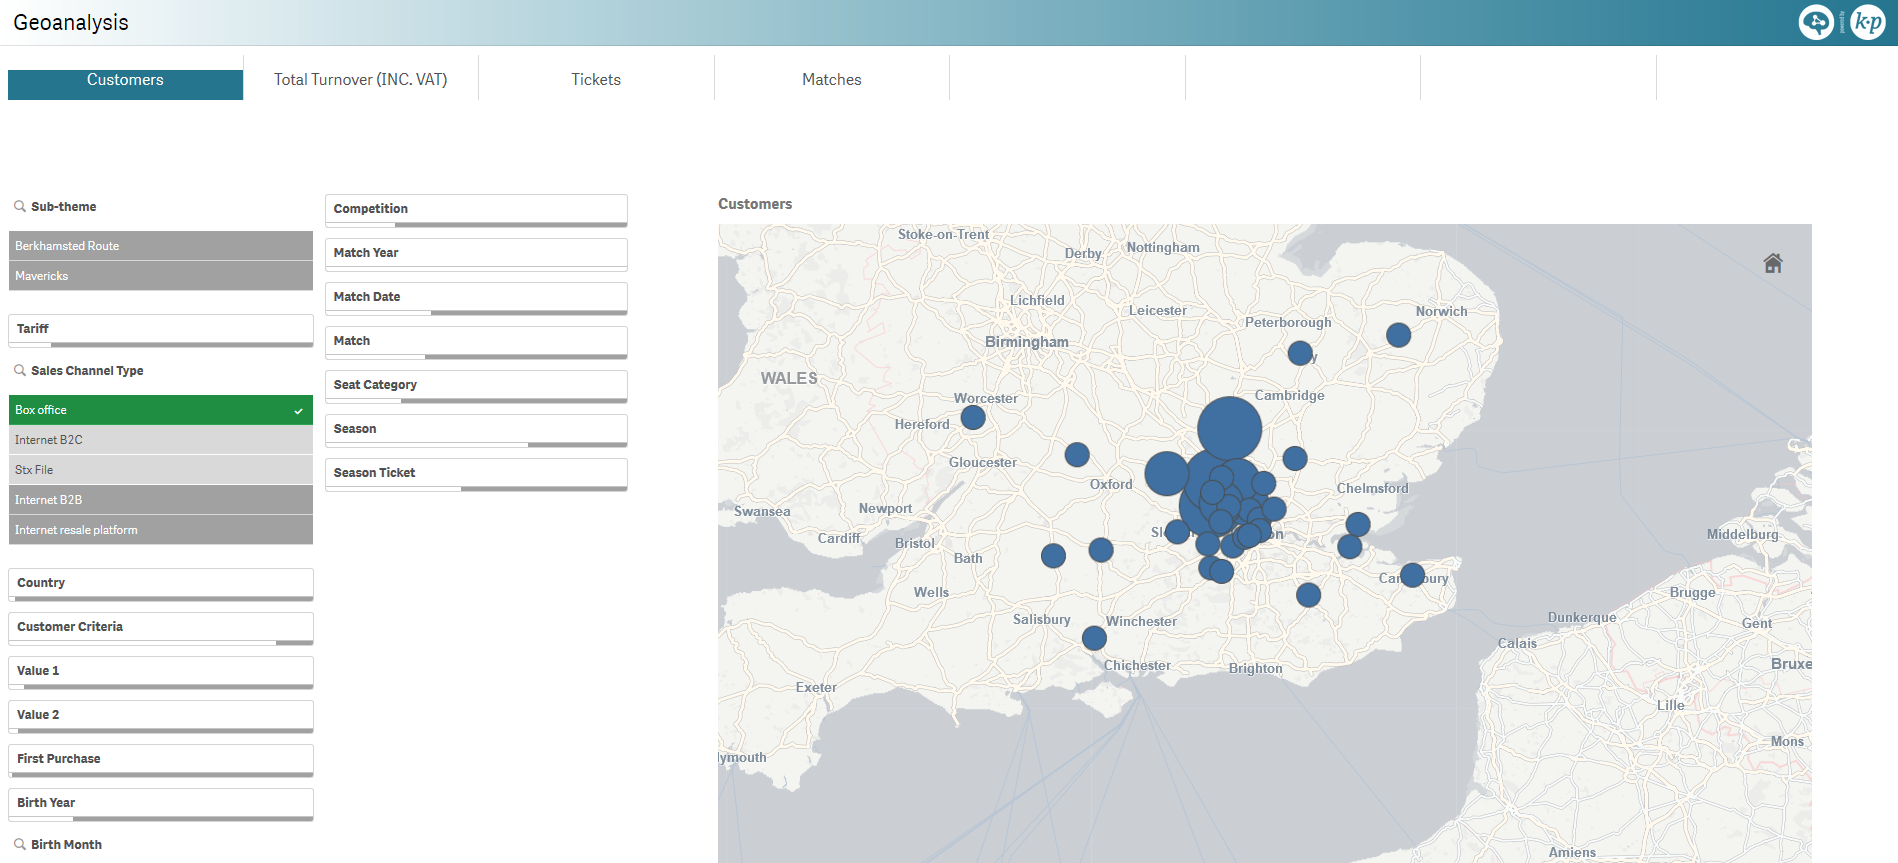
Geoanalysis [G]
Geographical map view of the following dimensions per postal code:
- Number of contacts
- Revenue
- Number of tickets sold
- Number of matches
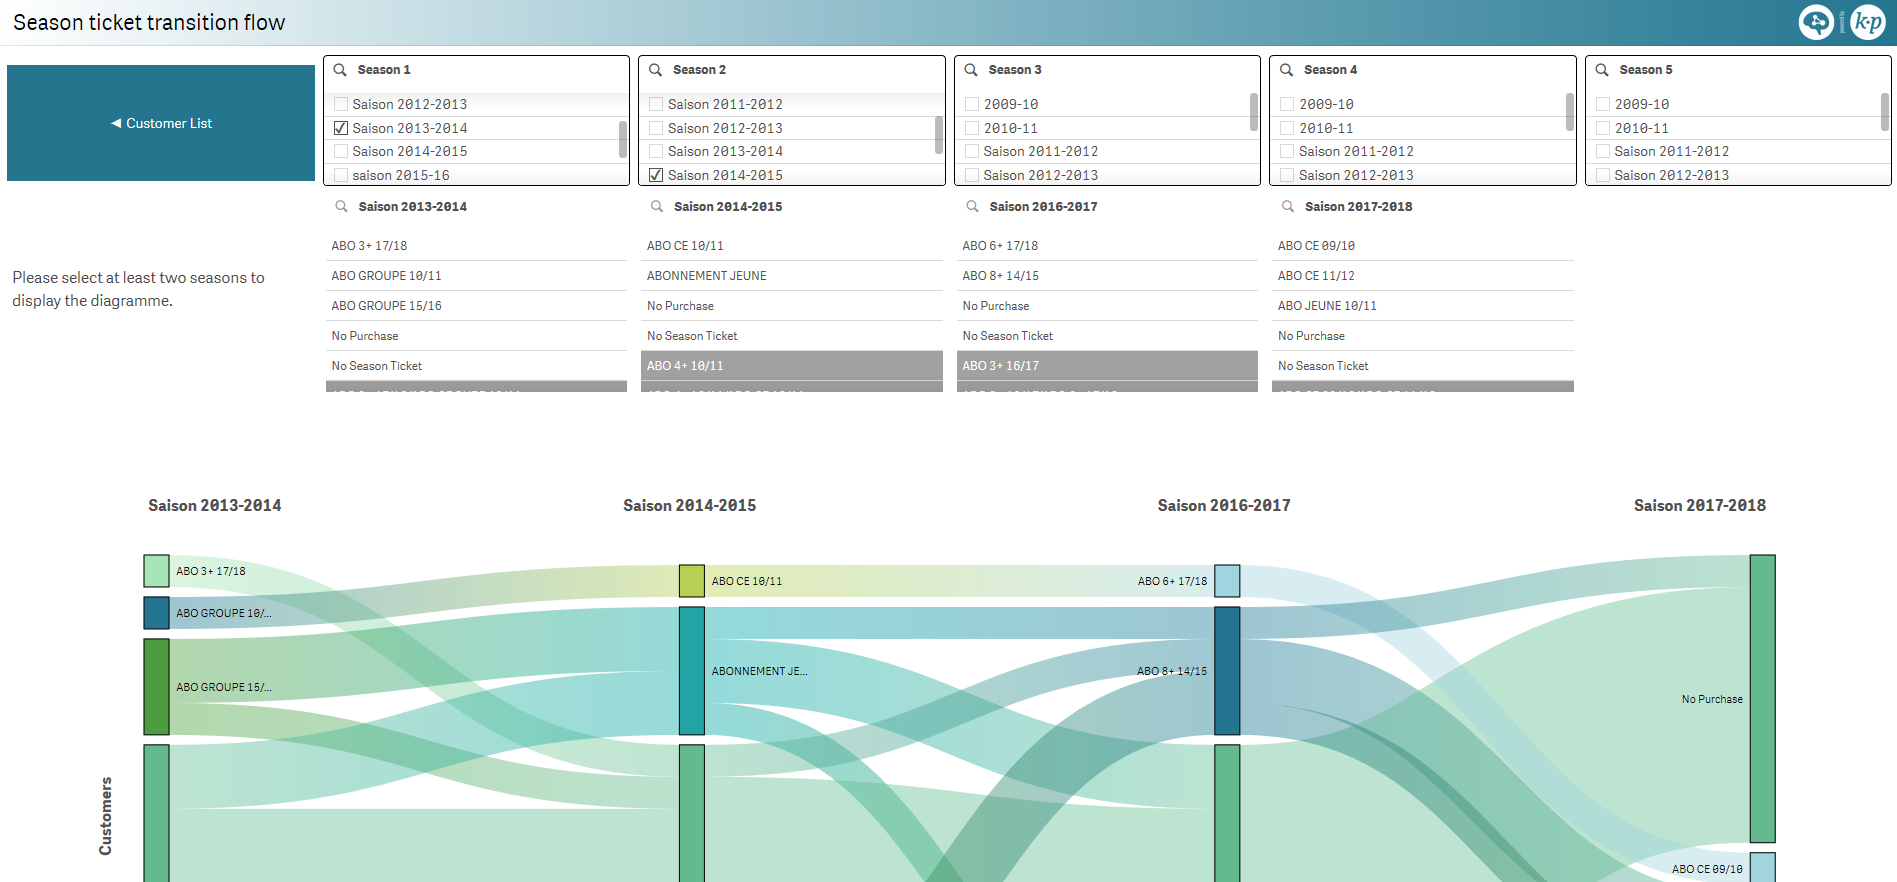
Season ticket transition flow [G]
Season ticket transition flow between seasons split between cultural contacts having:
- purchased a season ticket that season
- purchased a single entry but no season tickets that season
- not purchased anything at all that season
Flow data table for two seasons.
Note: Not available in the Museums vertical
LIVE ENTERTAINMENT
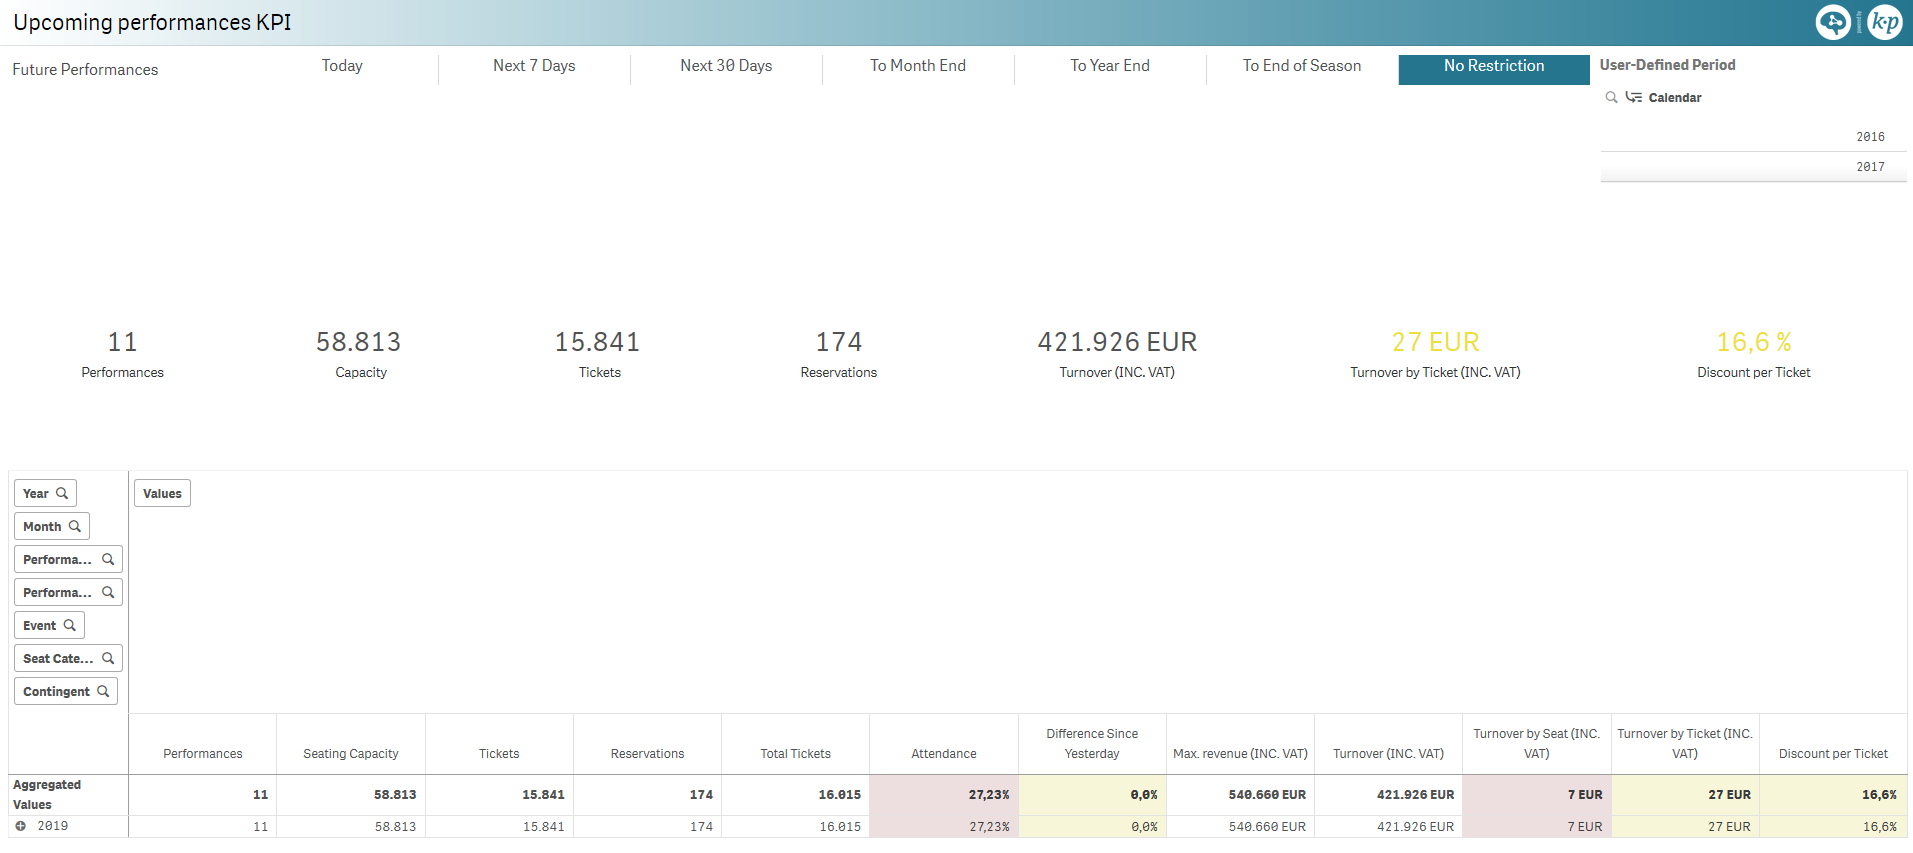
Upcoming performances KPI [LE]
Key Performance Indicators (KPI) for the upcoming performances, i.e., based on the performance date:
- Number of performances
- Total capacity
- Number of tickets sold
- Number of reservations
- Total revenue
- Revenue per ticket
- Average discount per ticket
Pivot table with the additional measures:
- Total tickets (sold + reserved)
- Attendance percentage
- Maximum revenue
- Revenue per seat
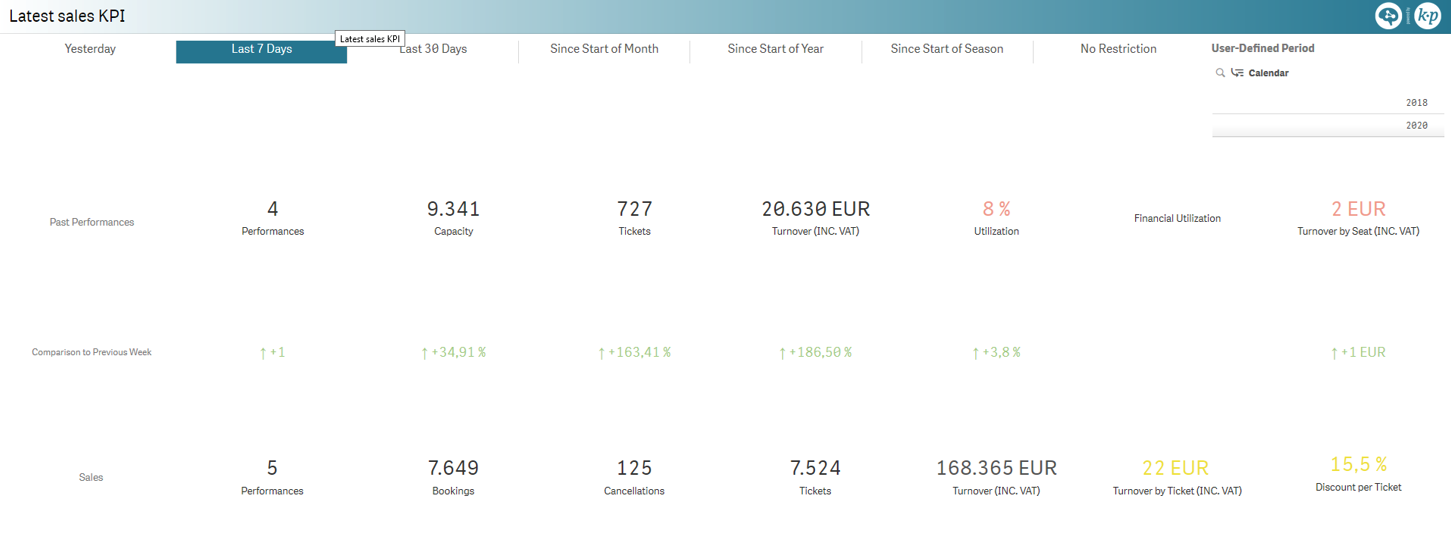
Latest sales KPI [LE]
KPI for the latest matches (based on performance date) and sales (based on sales date), compared with the previous period:
| Past performances | Sales |
|---|---|
|
|
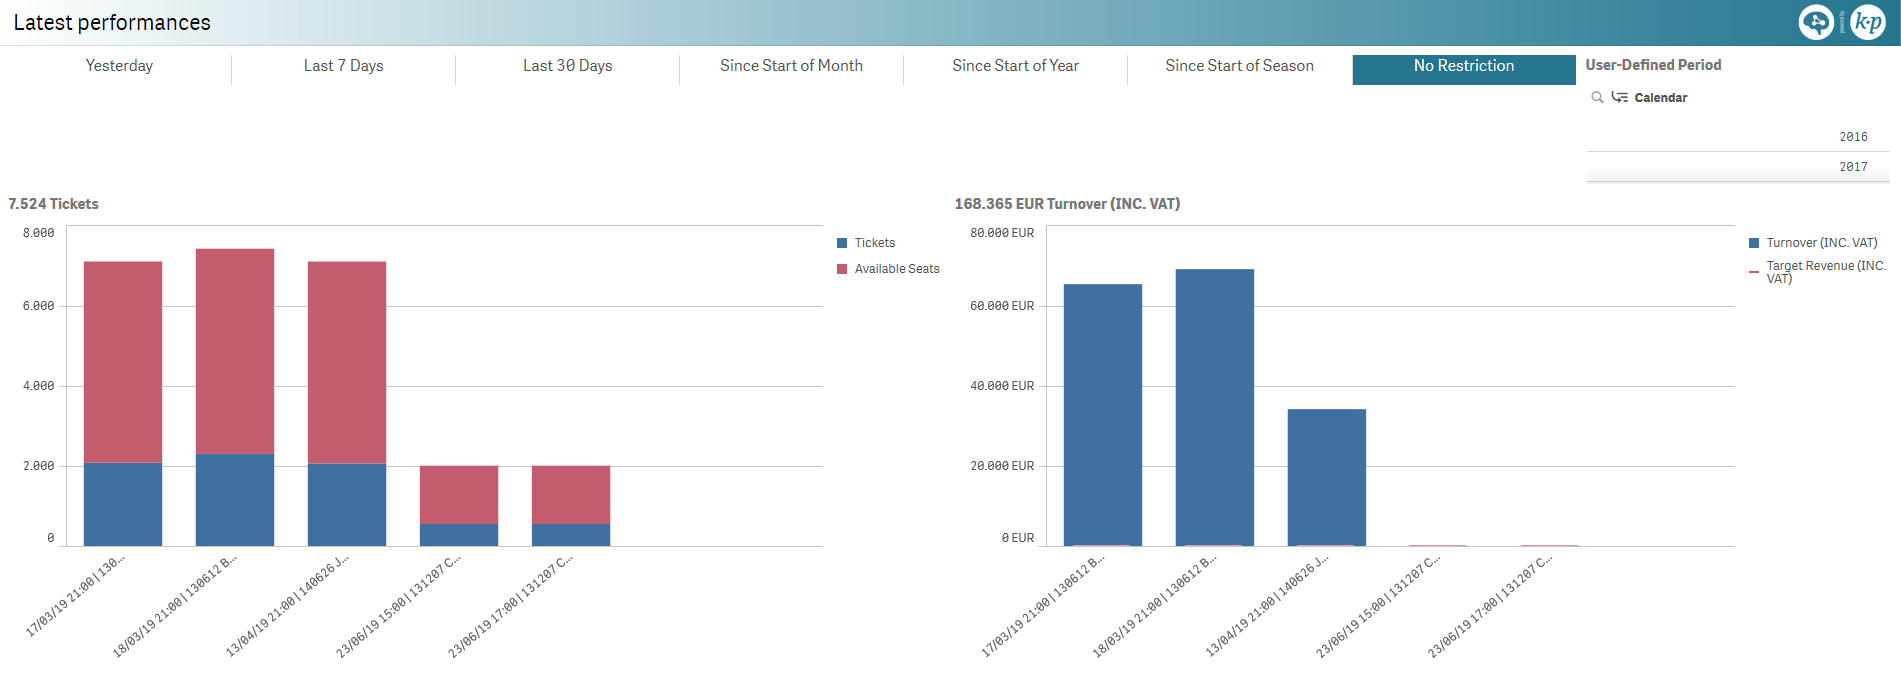
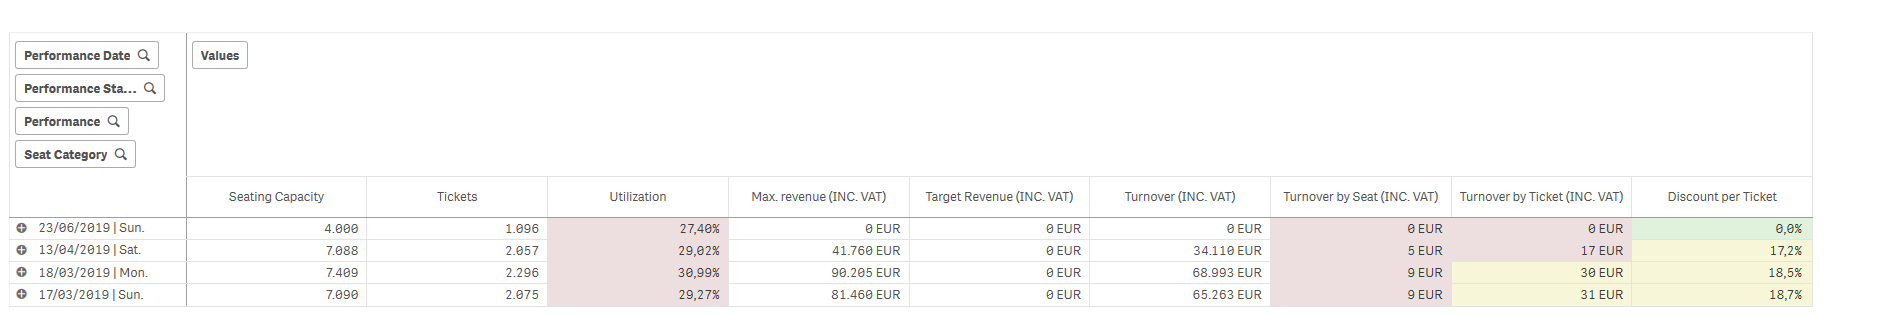
Latest performances [LE]
Ticket and revenue charts for the latest performances with respect to the full quota and target revenue respectively.
Pivot table by performance date, performance start time, performance and seat category, for the following measures:
- Seating capacity
- Number of sold tickets
- Capacity utilization
- Maximum revenue
- Target revenue
- Revenue
- Revenue per seat
- Revenue per ticket
- Discount per ticket
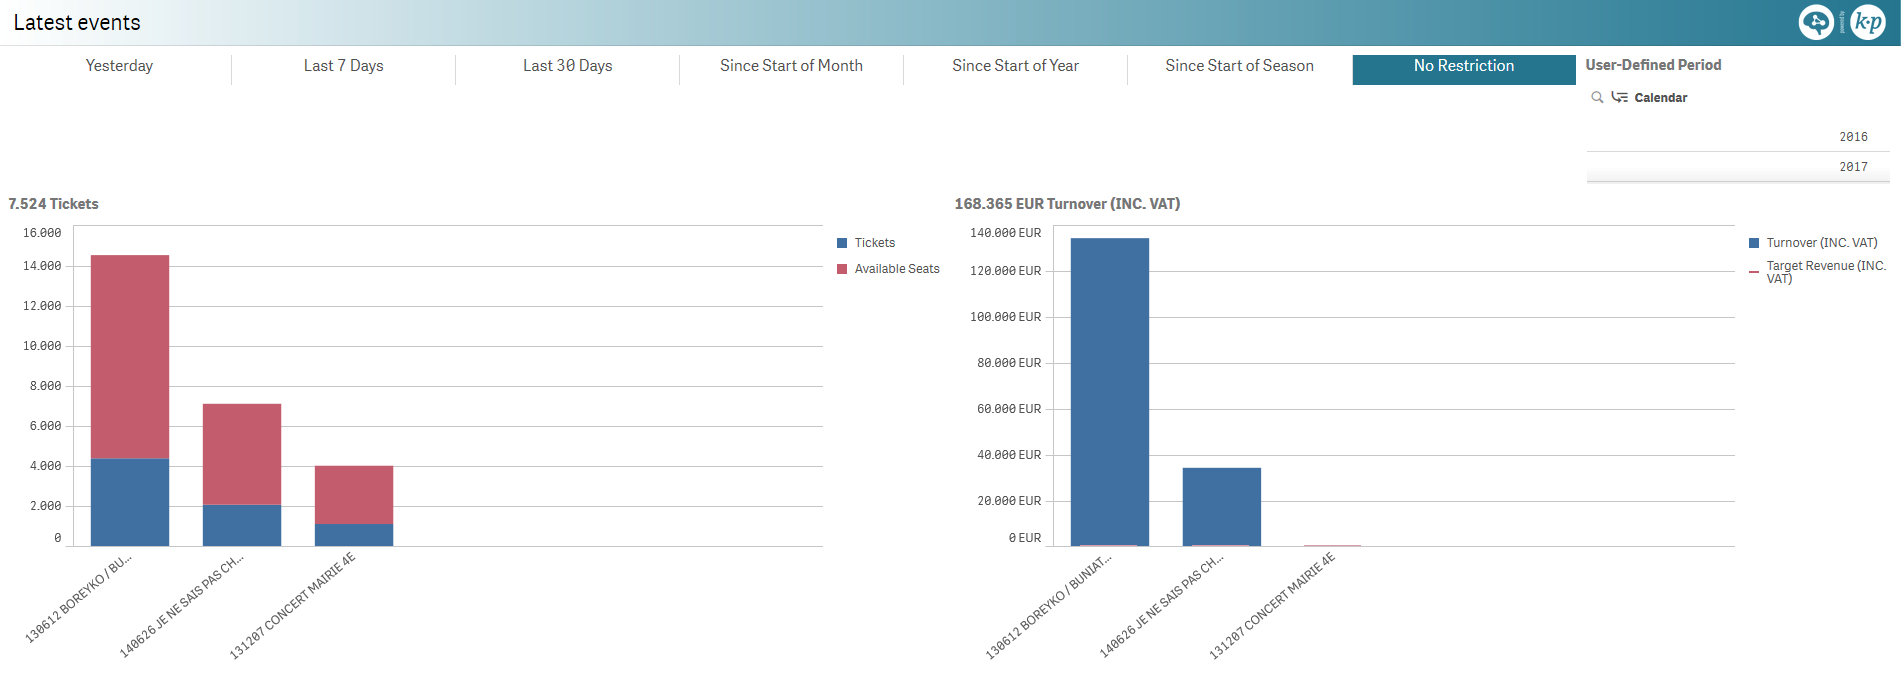
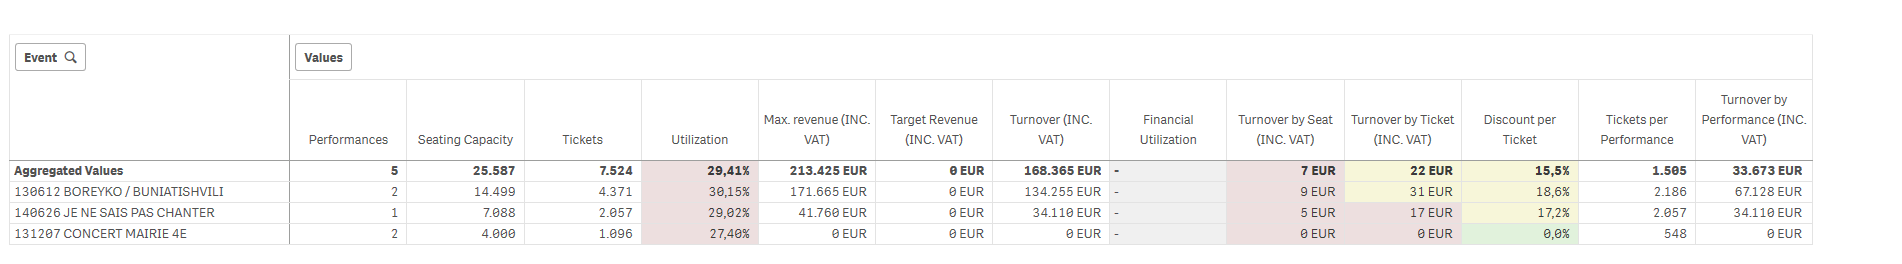
Latest events [LE]
Ticket and revenue charts for the latest events with respect to the full quota and target revenue respectively.
Pivot table by event for the following measures:
- Number of performances
- Seating capacity
- Number of sold tickets
- Capacity utilization
- Maximum revenue
- Target revenue
- Revenue
- Financial utilization
- Revenue per seat
- Revenue per ticket
- Discount per ticket
- Number of sold tickets per performance
- Revenue per performance
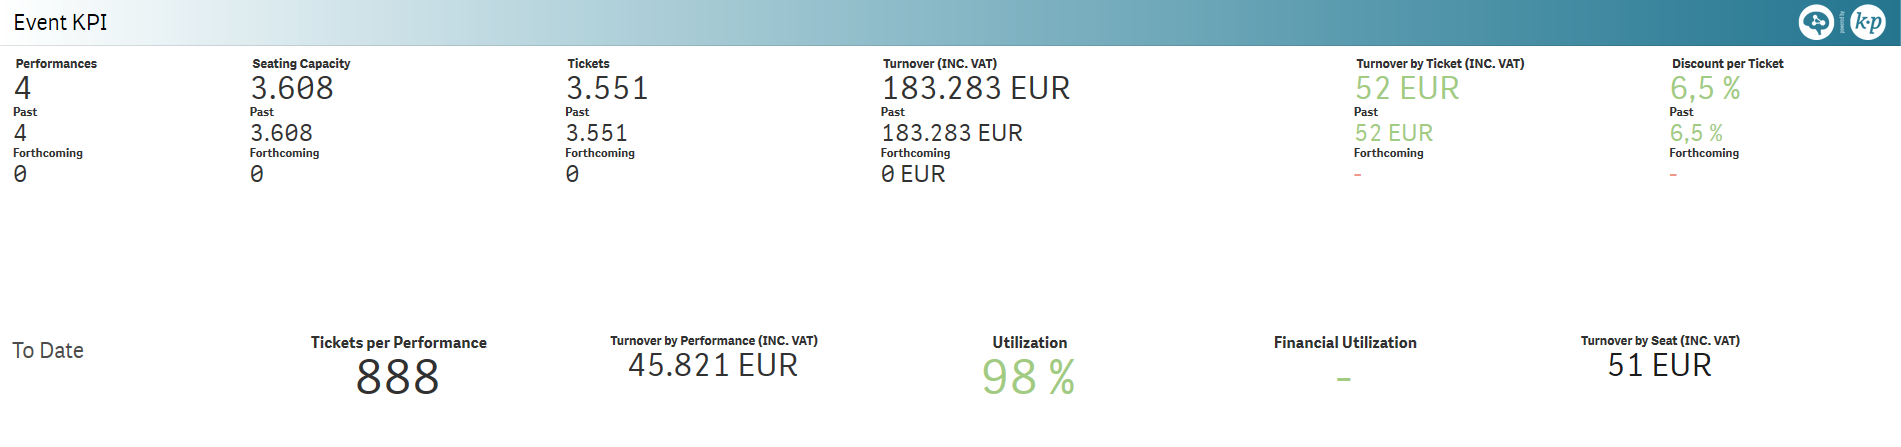
Event KPI [LE]
KPI for an ongoing event, with a split on past and forthcoming performances:
Number of performances
Seating capacity
Number of sold tickets
Turnover
Turnover per ticket
- Discount per ticket
and a view on the sales to date for the entire competition:
Number of sold tickets per performance
Revenue per performance
Capacity utilization
- Financial utilization
Revenue per seat
Note: Best for a selected competition.
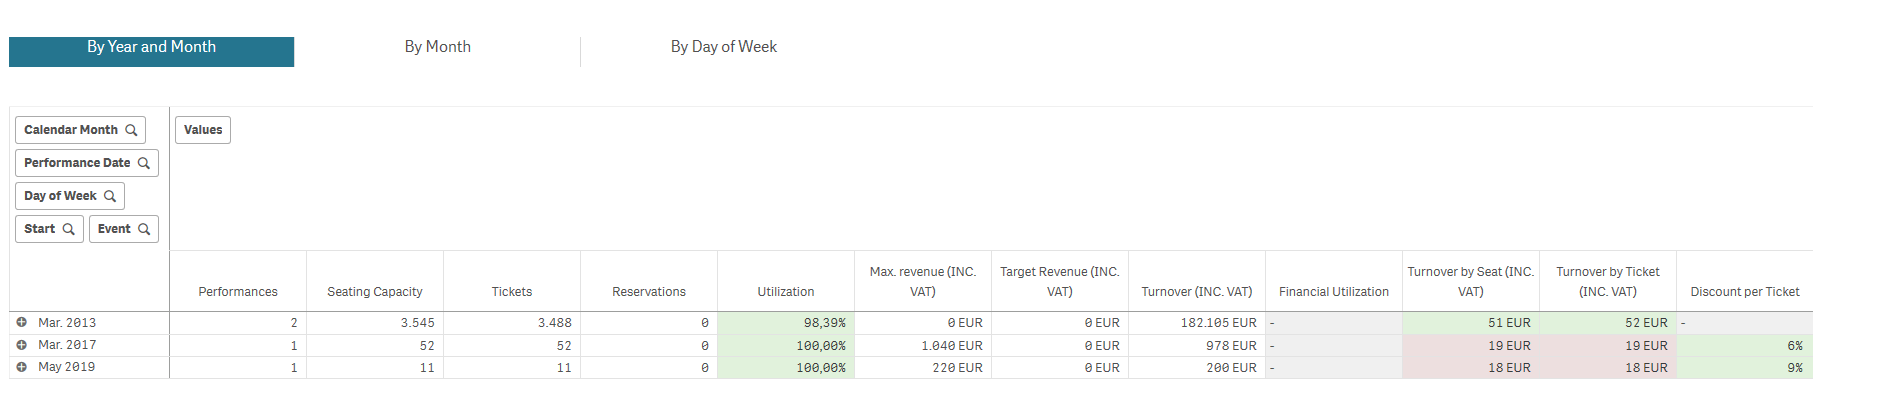
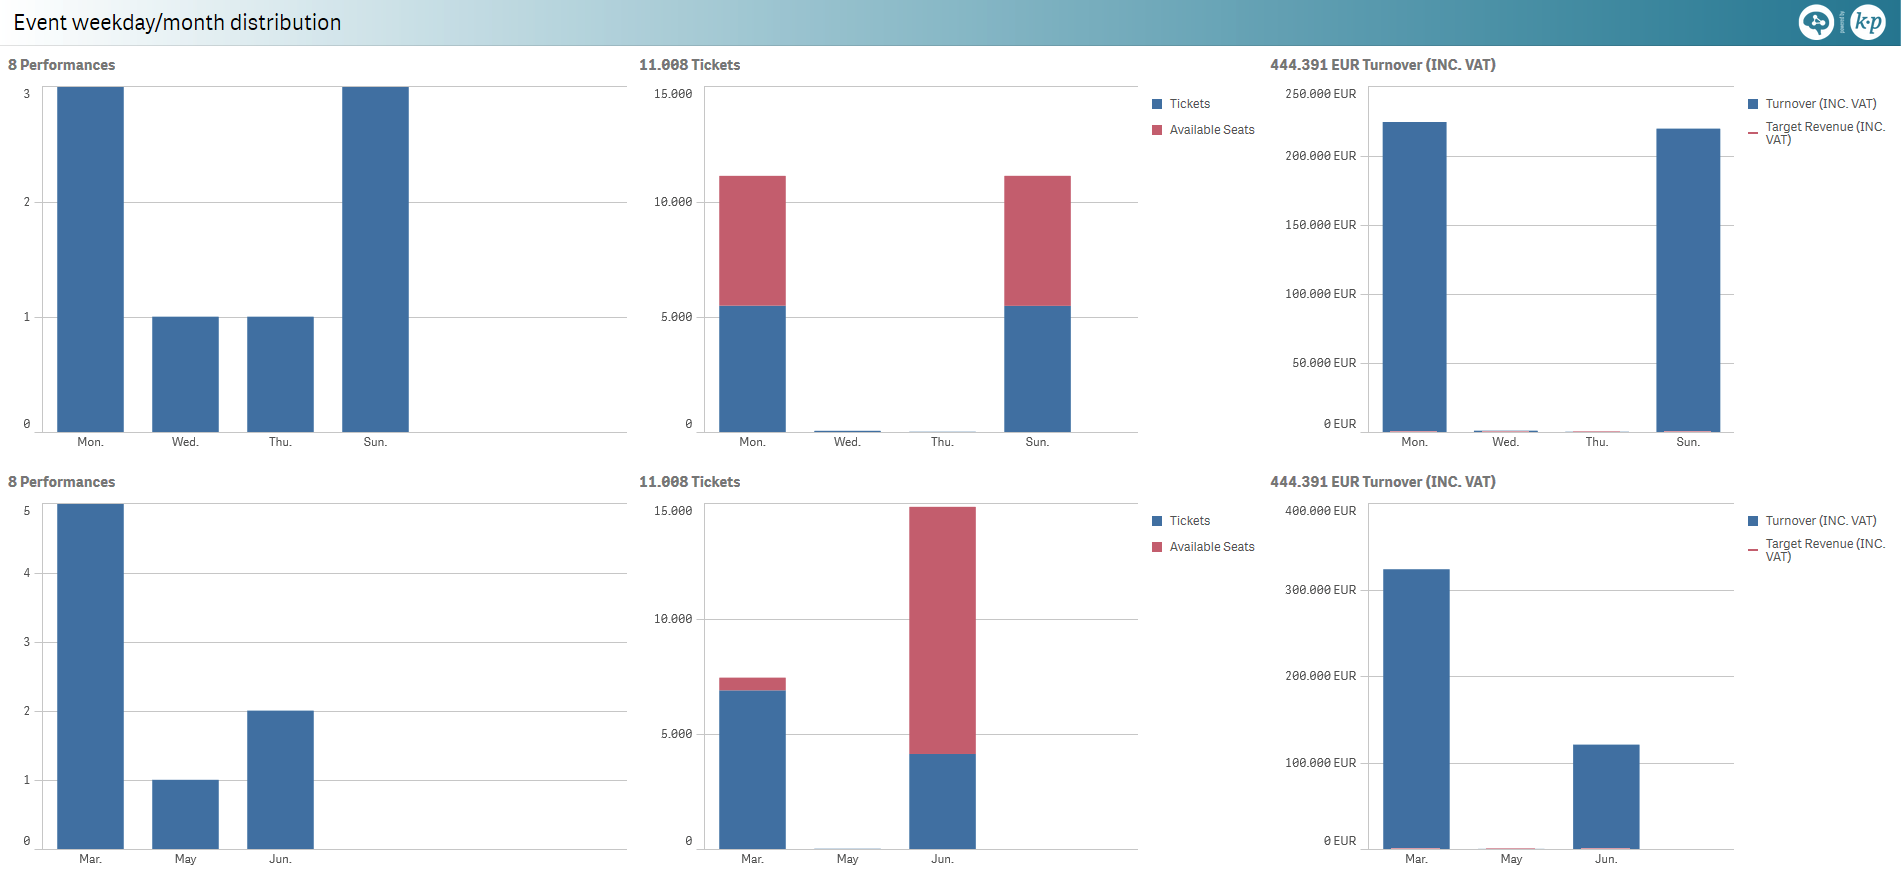
Event weekday/month distribution [LE]
Number of performances, sold tickets/available seats and revenue/target revenue charts distributed over:
days of the week
months
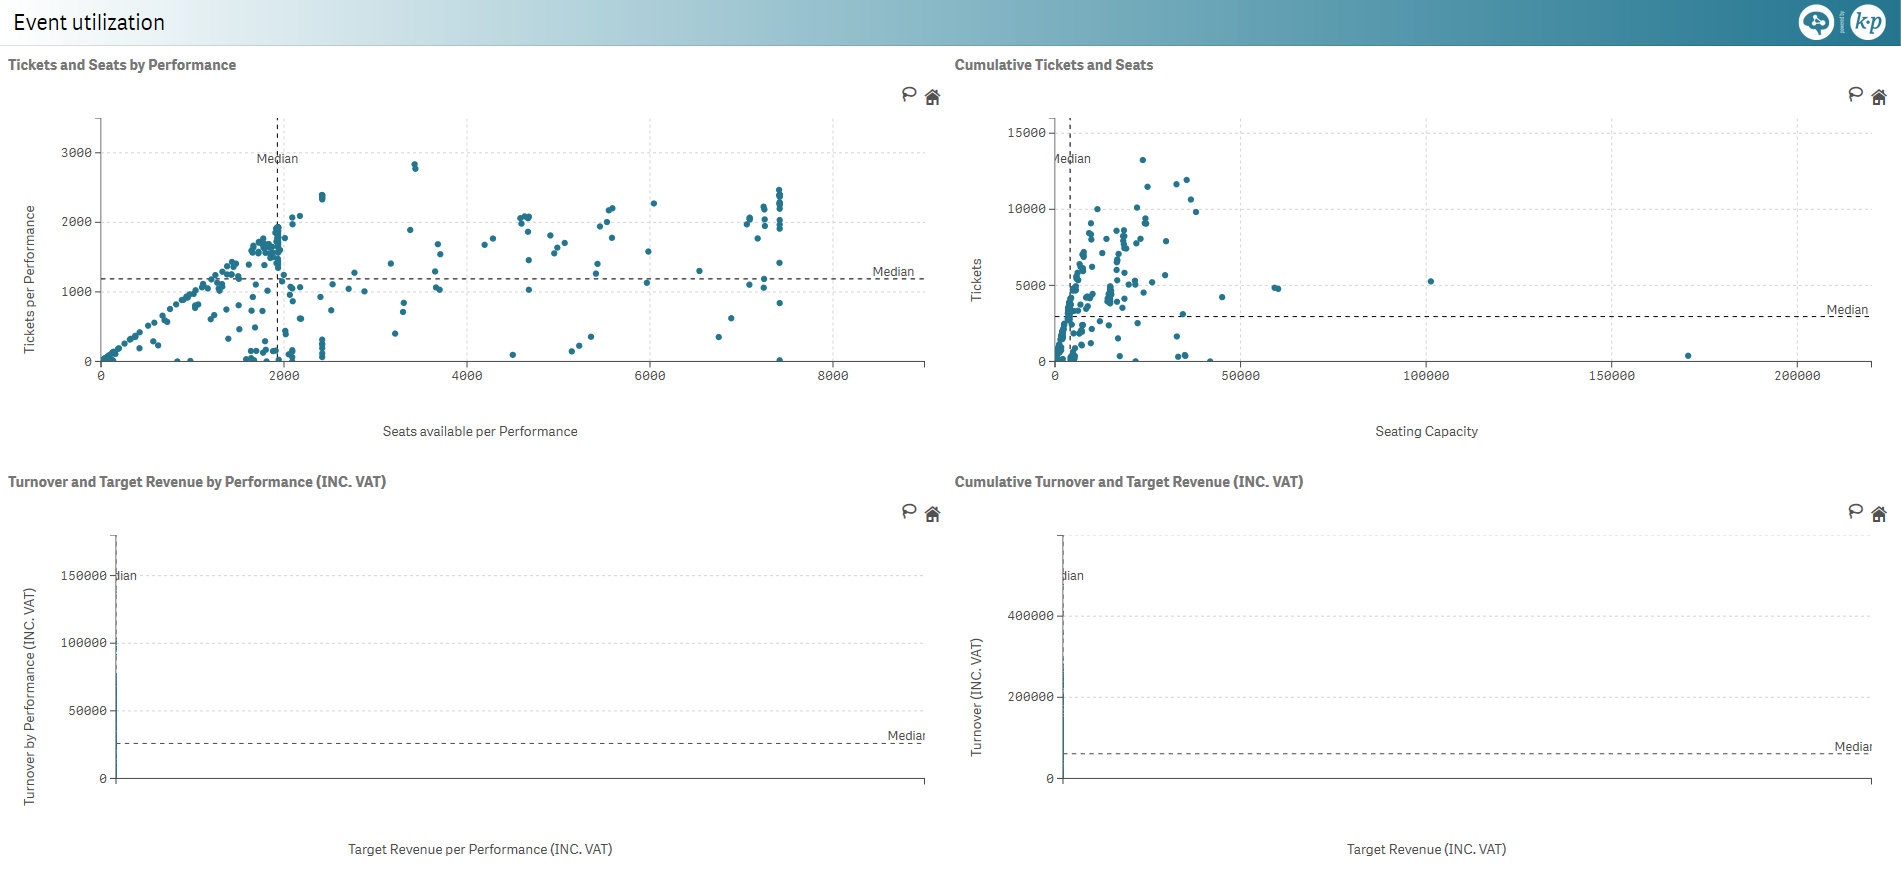
Event utilization [LE]
Scatter plot of performances and events for the following sets of dimensions:
- number of sold tickets versus seating capacity
- revenue and target revenue
Note: target revenues can be defined in the catalogue module of SecuTix, see here for more details.
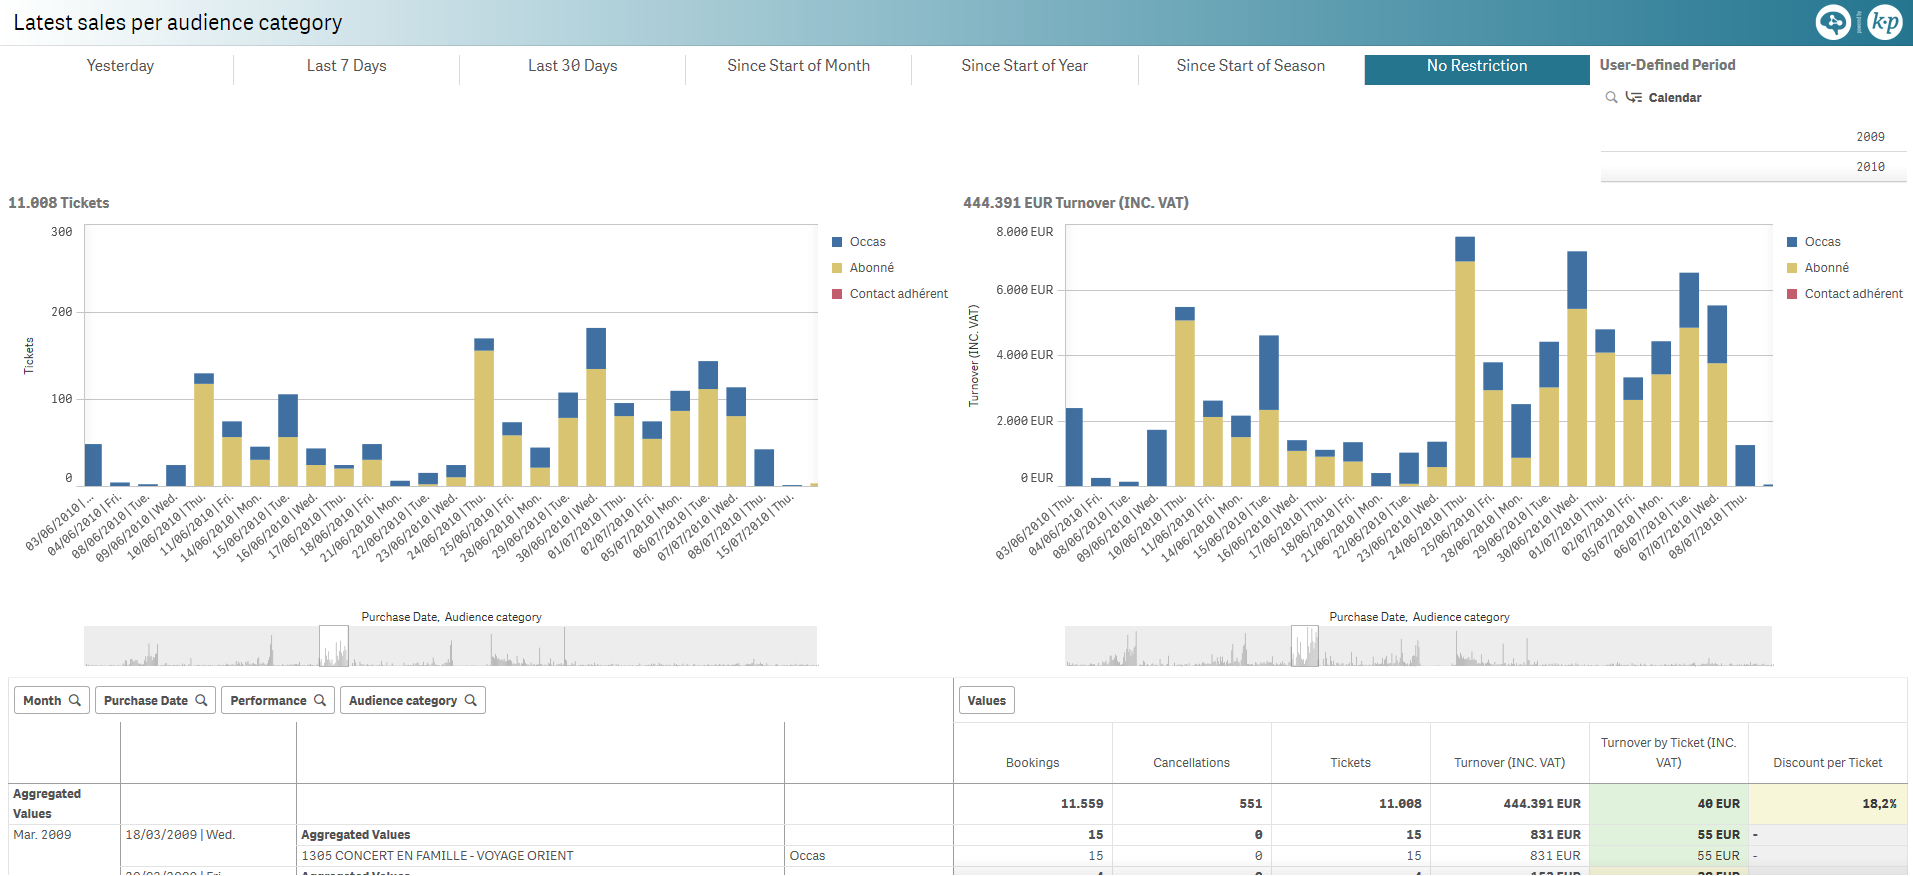
Latest sales per audience category [LE]
Latest ticket sales and revenue per sales date, split by audience category.
Pivot table by purchase month, purchase date, performance and audience category for the following measures:
- Number of sold tickets (including cancellations)
- Number of cancellations
- Number of sold tickets
- Revenue
- Revenue per ticket
- Discount per ticket
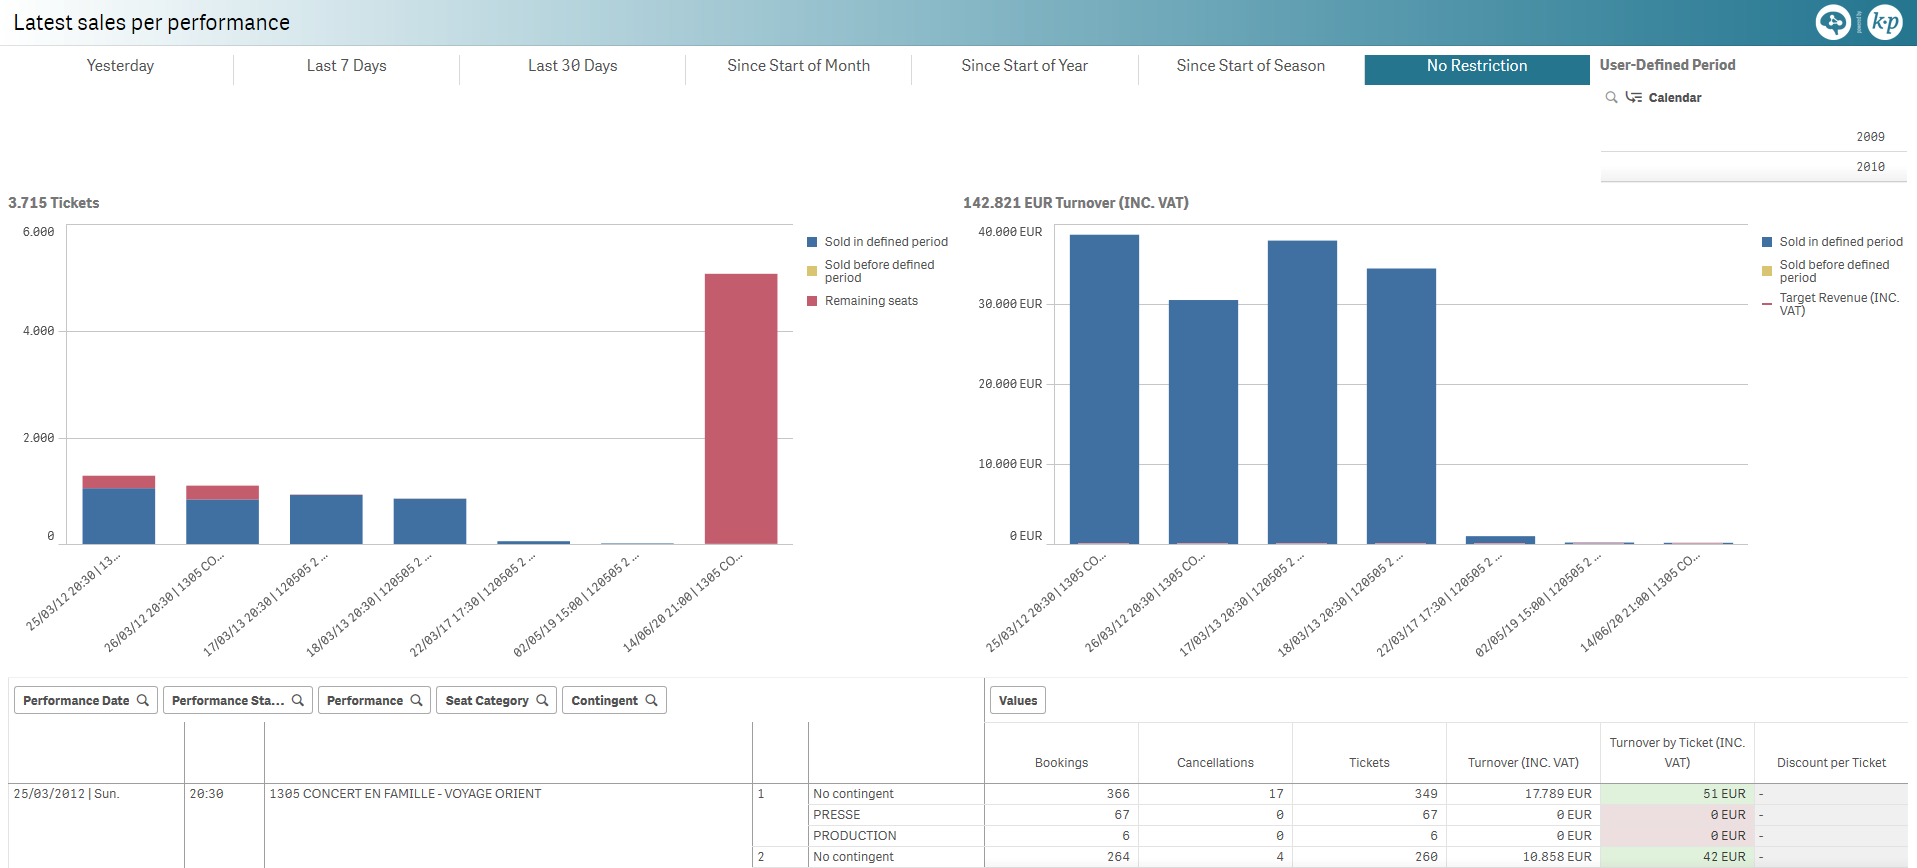
Latest sales per performance [LE]
Sold tickets/available seats and revenue/target revenue per match, split between latest sales and prior sales.
Pivot table by performance date, performance start time, match, seat category and contingent for the following measures:
- Number of sold tickets (including cancellations)
- Number of cancellations
- Number of sold tickets
- Revenue
- Revenue per ticket
- Discount per ticket
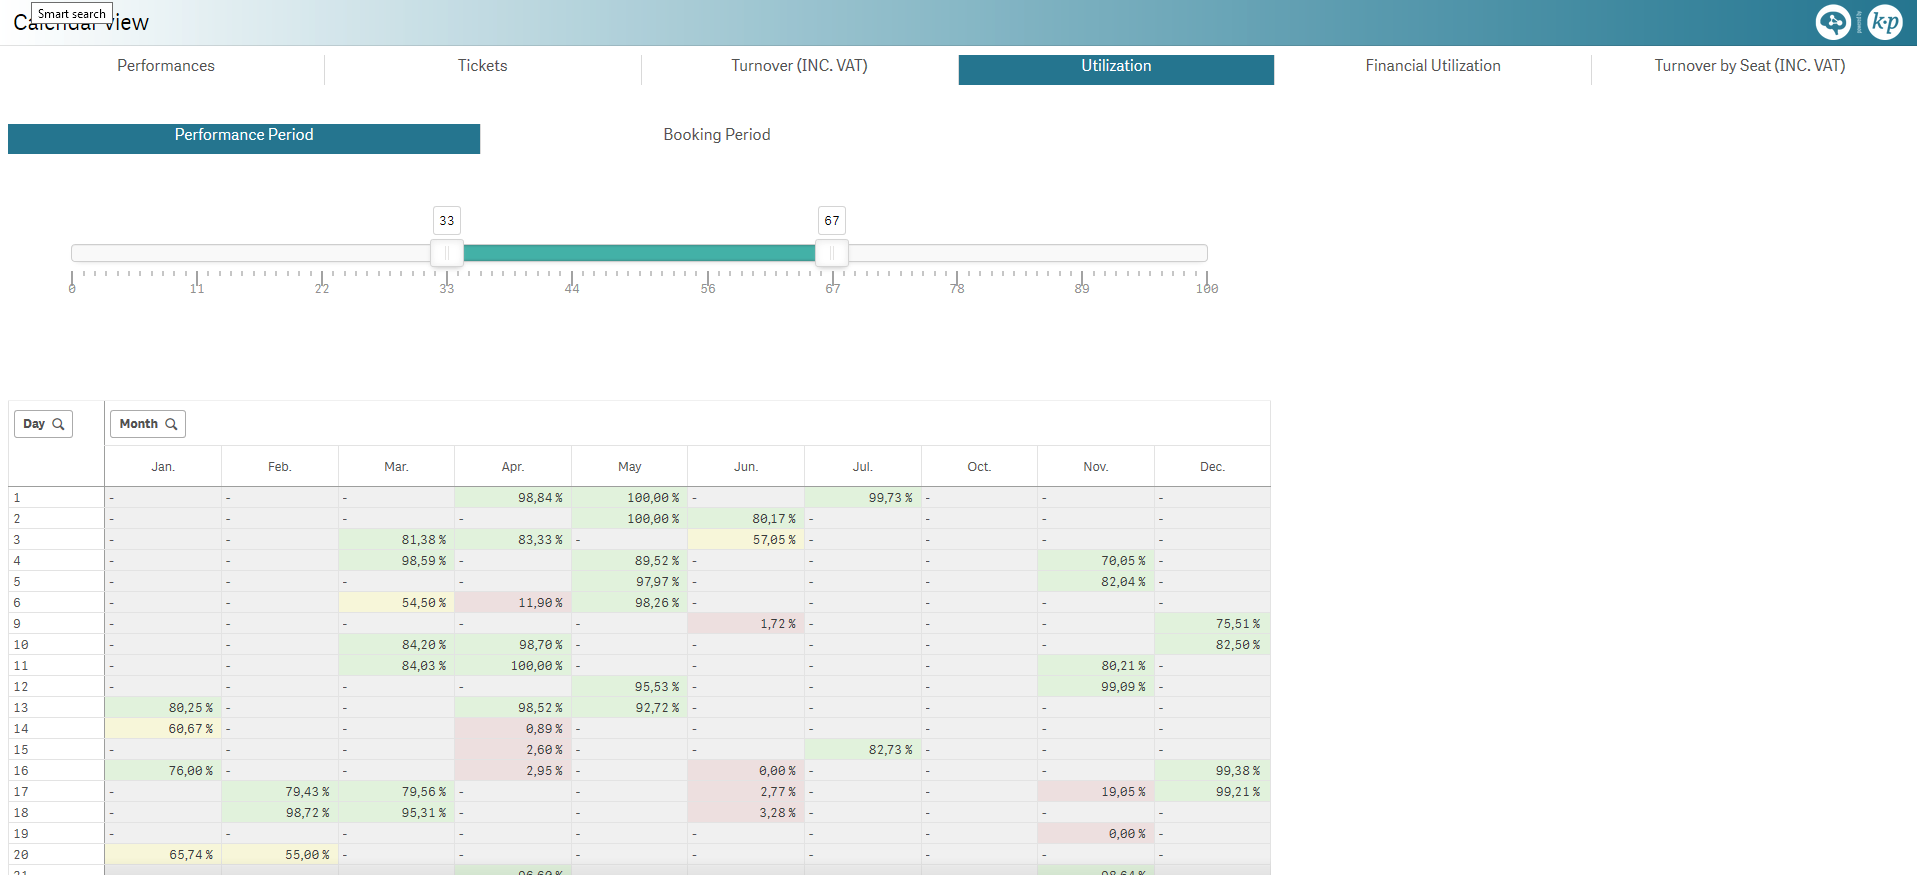
Calendar view [LE]
Performance date and purchase date calendar view, with coloring sliders, for the following dimensions:
- Number of performances
- Number of sold tickets
- Revenue
- Capacity utilization
- Financial utilization
- Revenue per seat
Year/season comparison [LE]
Sold tickets and revenue monthly comparison over two seasons or years, including cumulative numbers.
Pivot table by month of the performance, event, sub-theme and venue for the following measures of each selected periods and the differences:
- Number of performances
- Number of sold tickets
- Capacity utilization
- Revenue
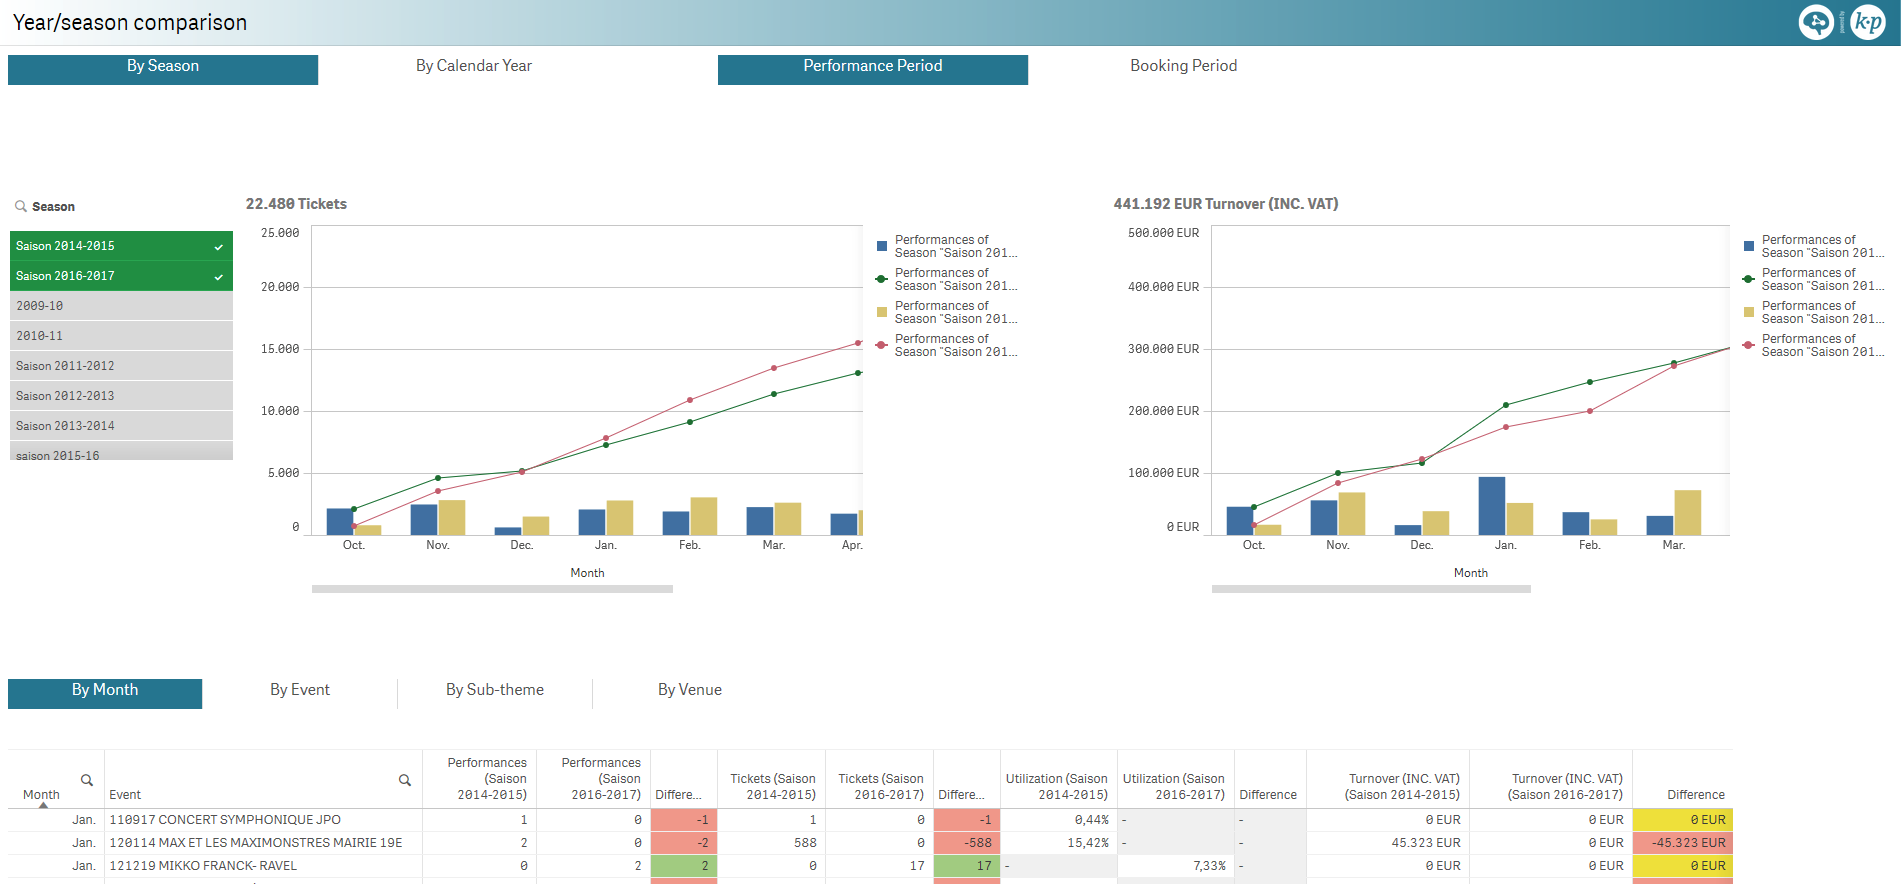
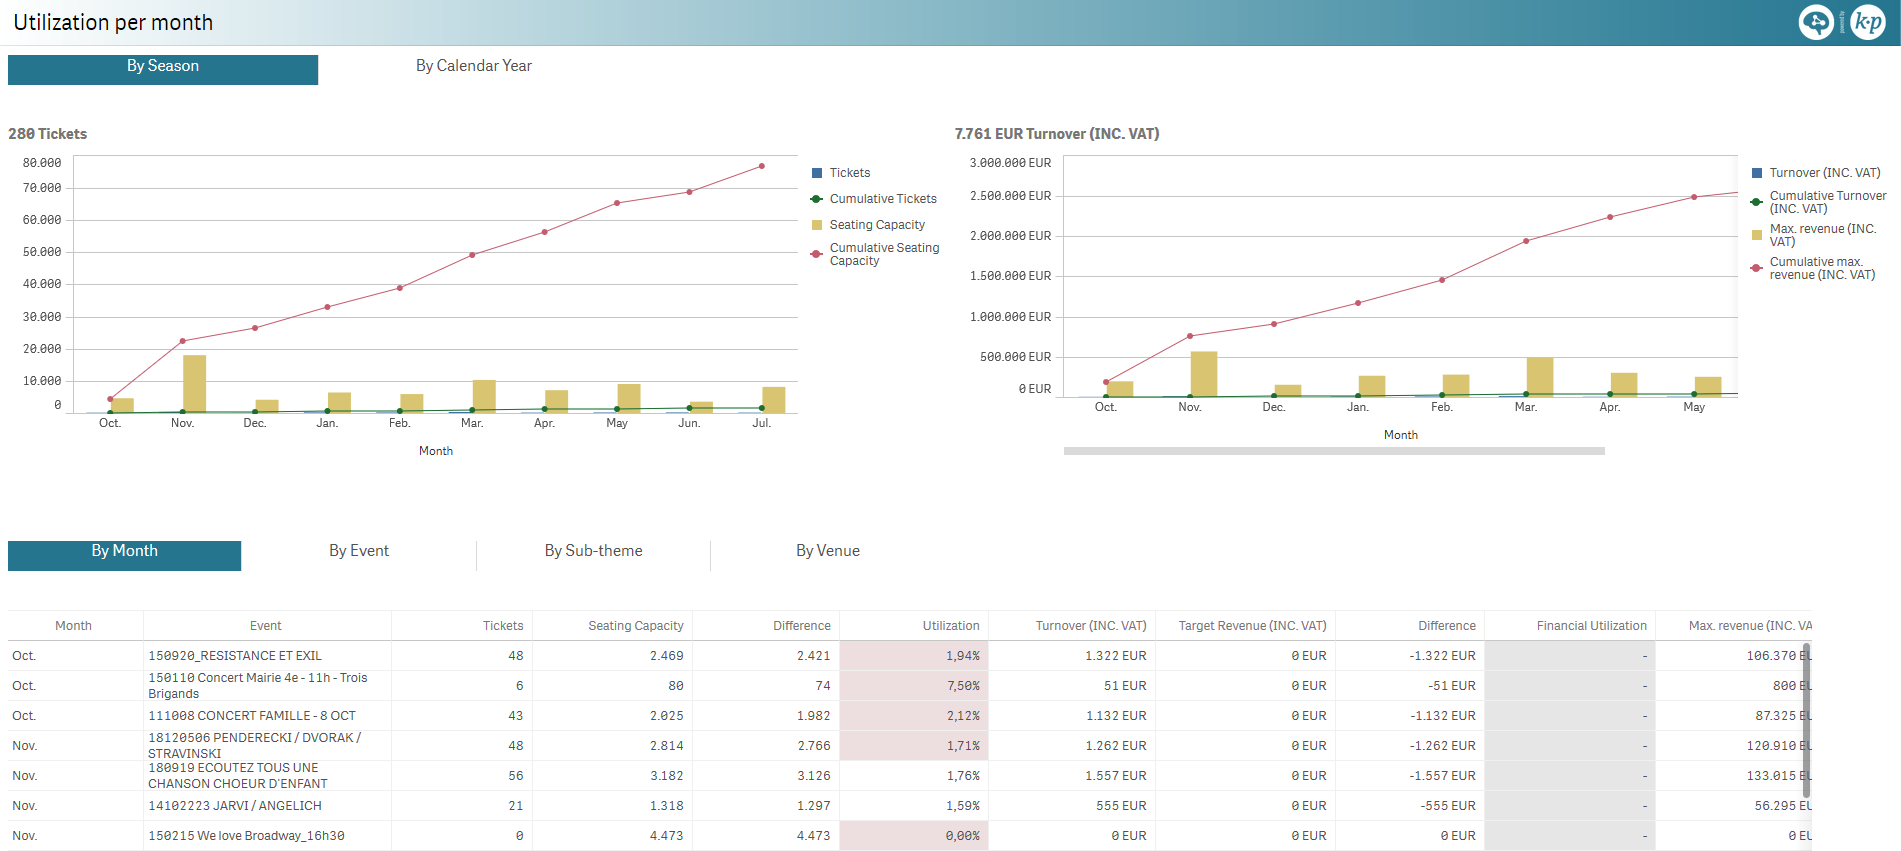
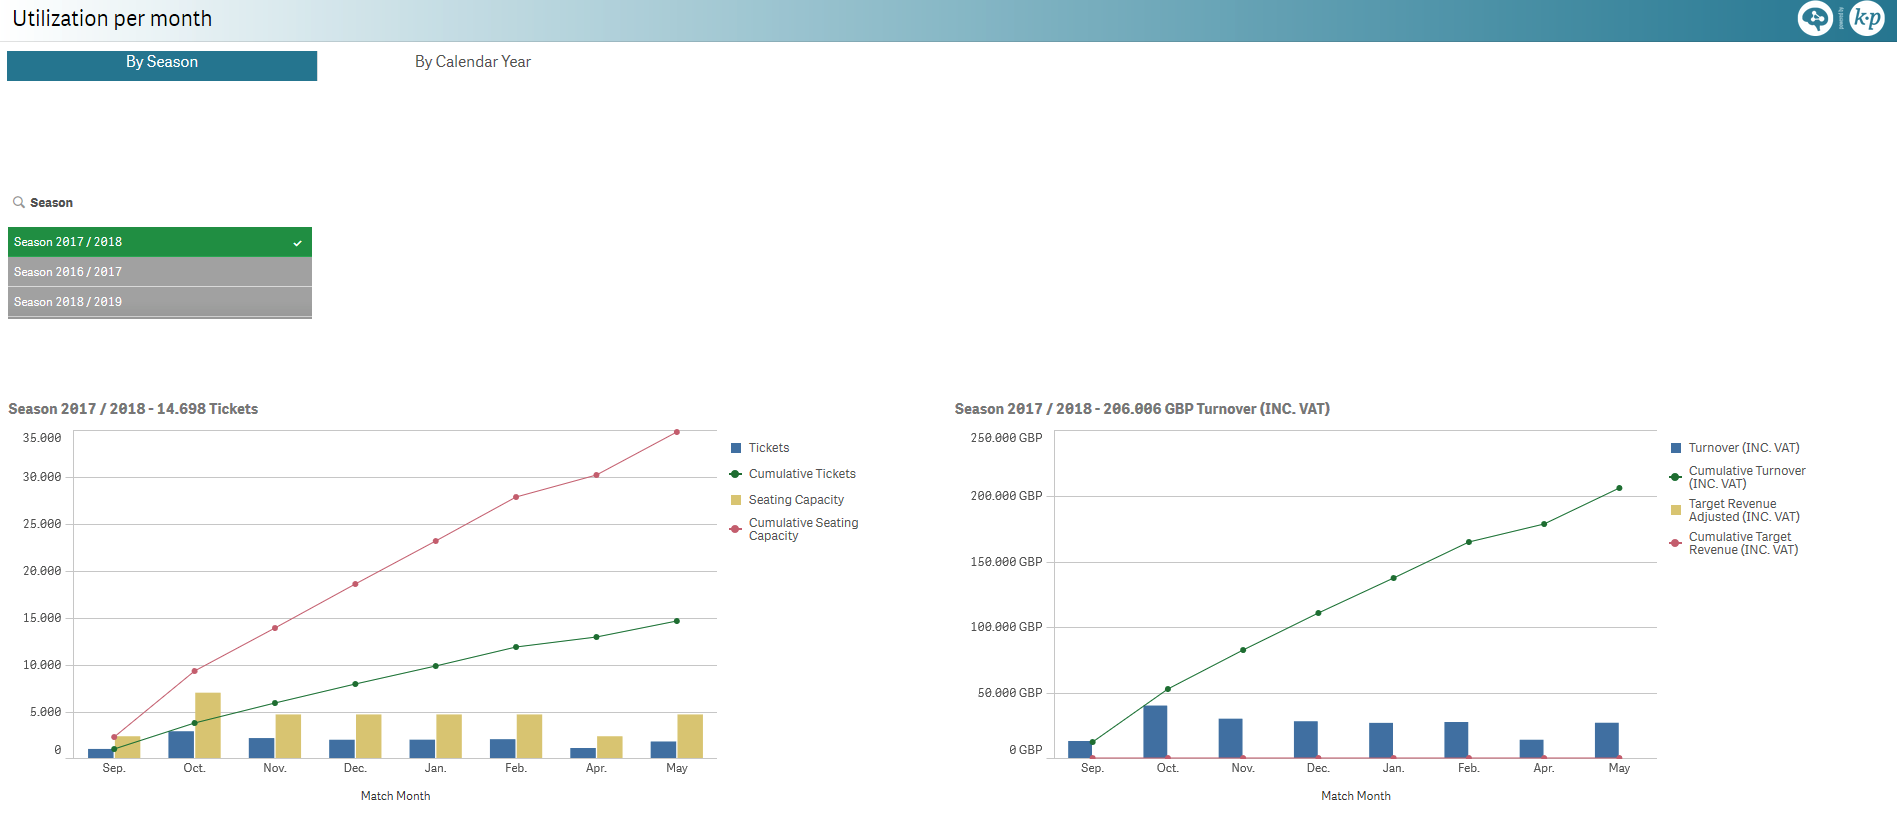
Utilization per month [LE]
Sold tickets and revenue monthly comparison with respect to the full quota and target revenue respectively.
Pivot table by month of the match, event, sub-theme and venue for the following measures:
- Number of sold tickets
- Seating capacity
- Difference between the seating capacity and the number of sold tickets
- Capacity utilization
- Revenue
- Target revenue
- Difference between the adjusted target revenue and the revenue
- Financial utilization
- Maximum revenue
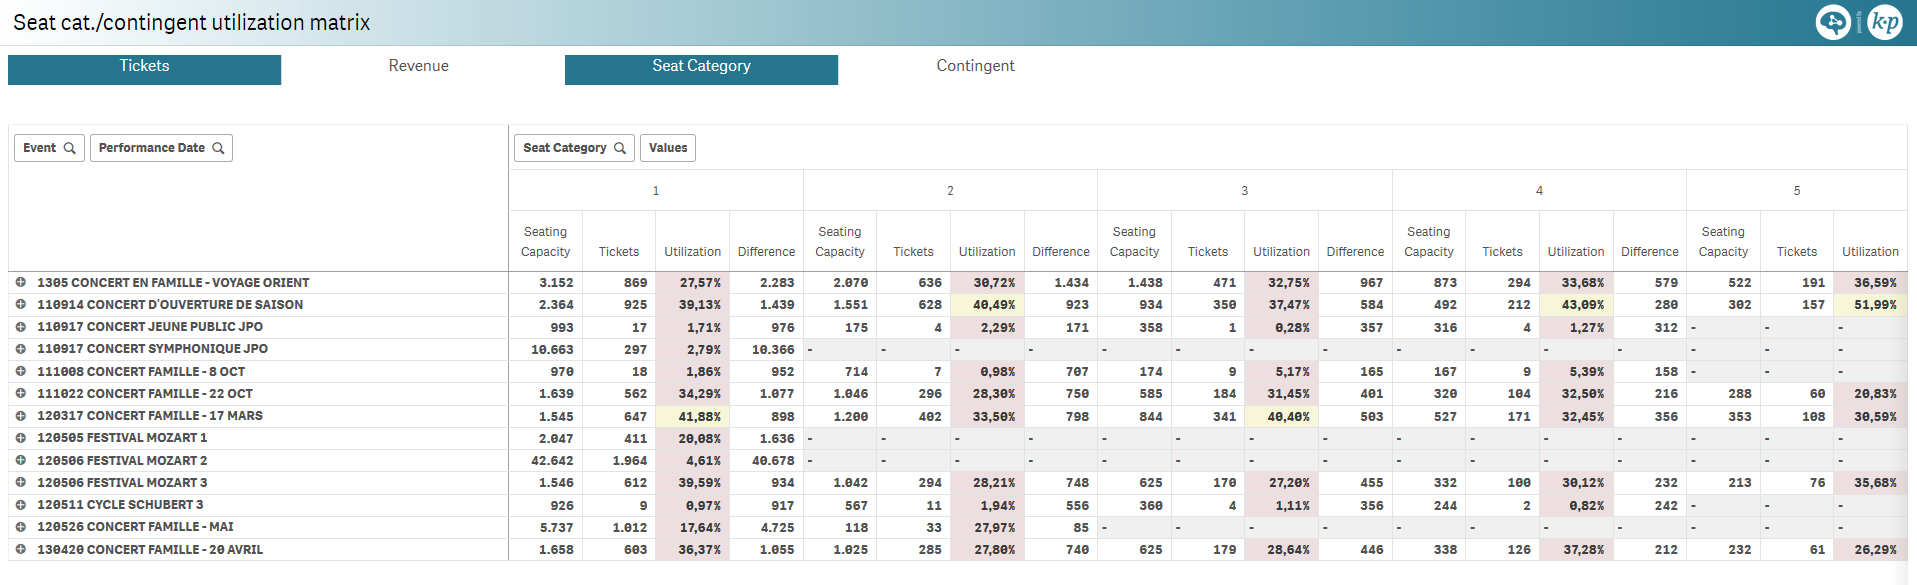
Seat cat./contingent utilization matrix [LE]
Pivot table by event and performance date for the following measures, split over seat category and contingent:
| Tickets | Revenue |
|---|---|
|
|
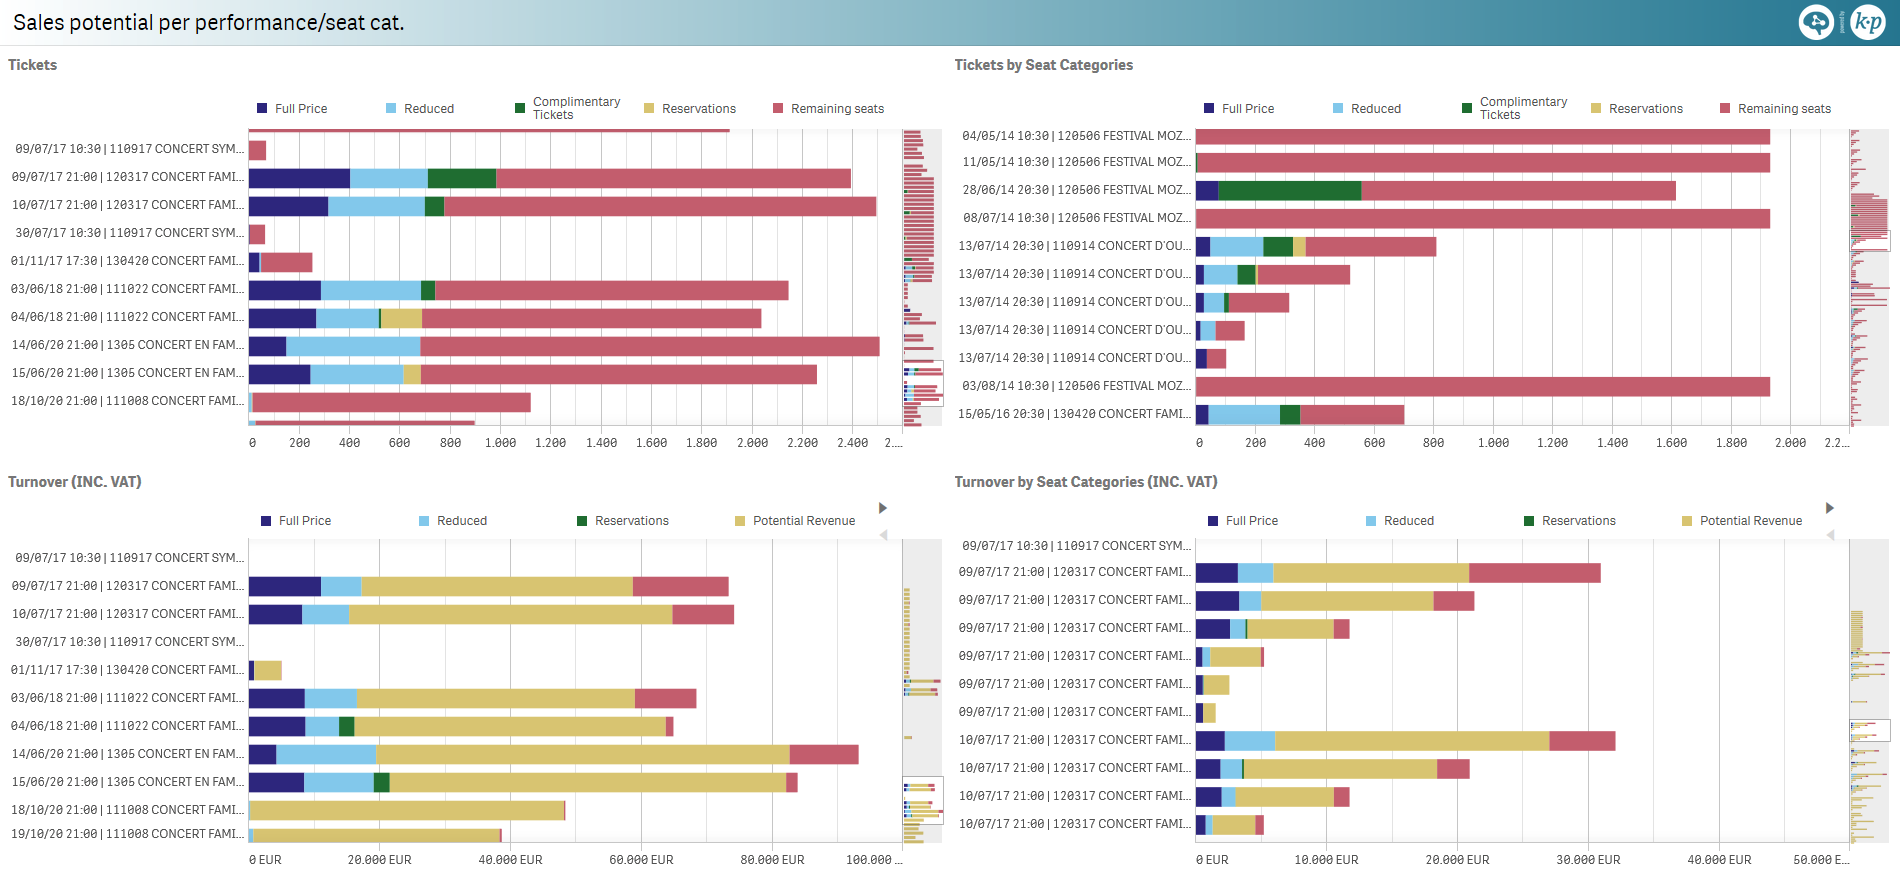
Sales potential per performance/seat cat. [LE]
Sold tickets and revenue distributed per performance and per seat category and performance, split by:
- Full price
- Reduced
- Complementary tickets
- Reservations
- Remaining seats
- Potential revenue
Reservations and remaining seats allow working on optimizing potential sales.
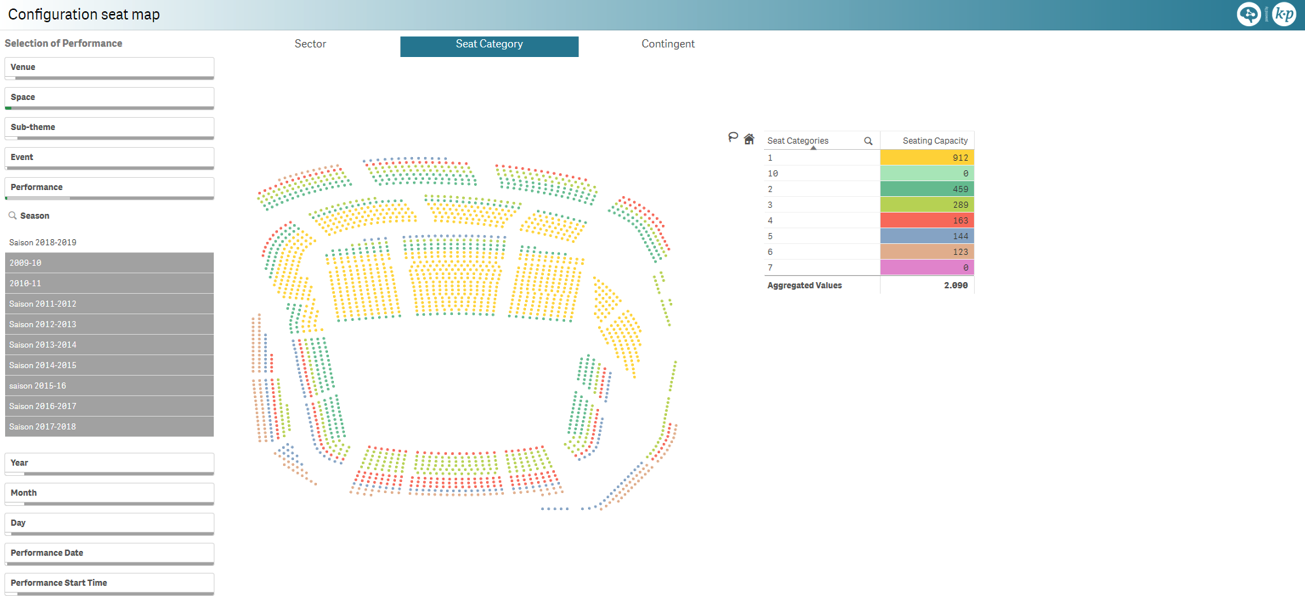
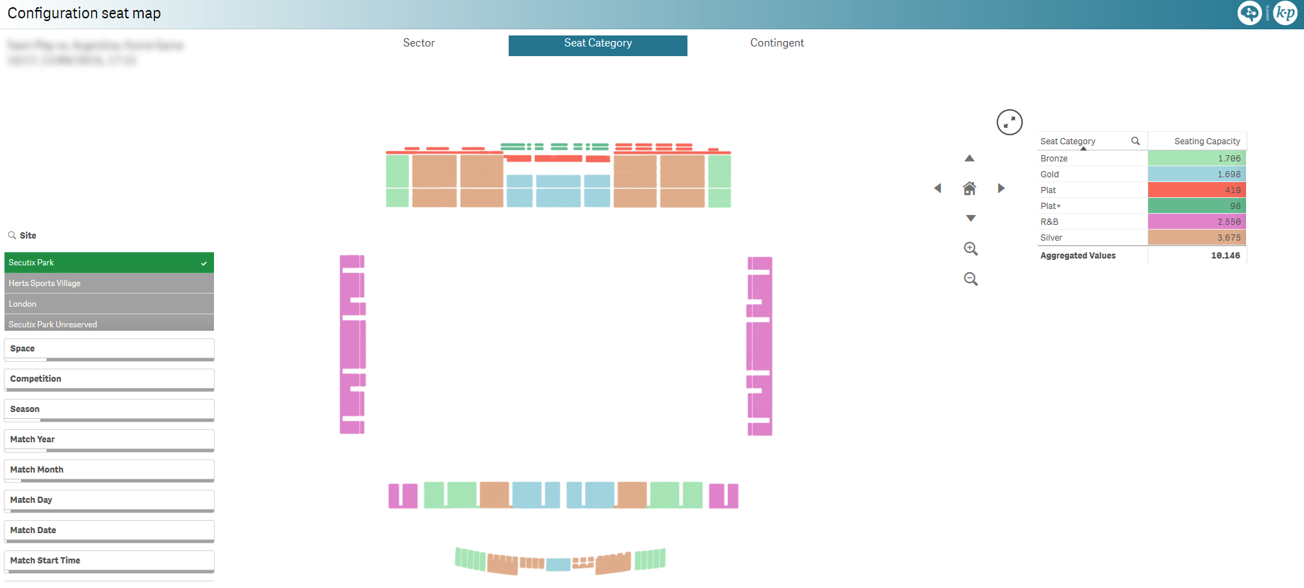
Configuration seat map [LE]
Seat map view of the configuration for a given performance, color coded by either:
- Sectors (area)
- Seat categories
- Contingents
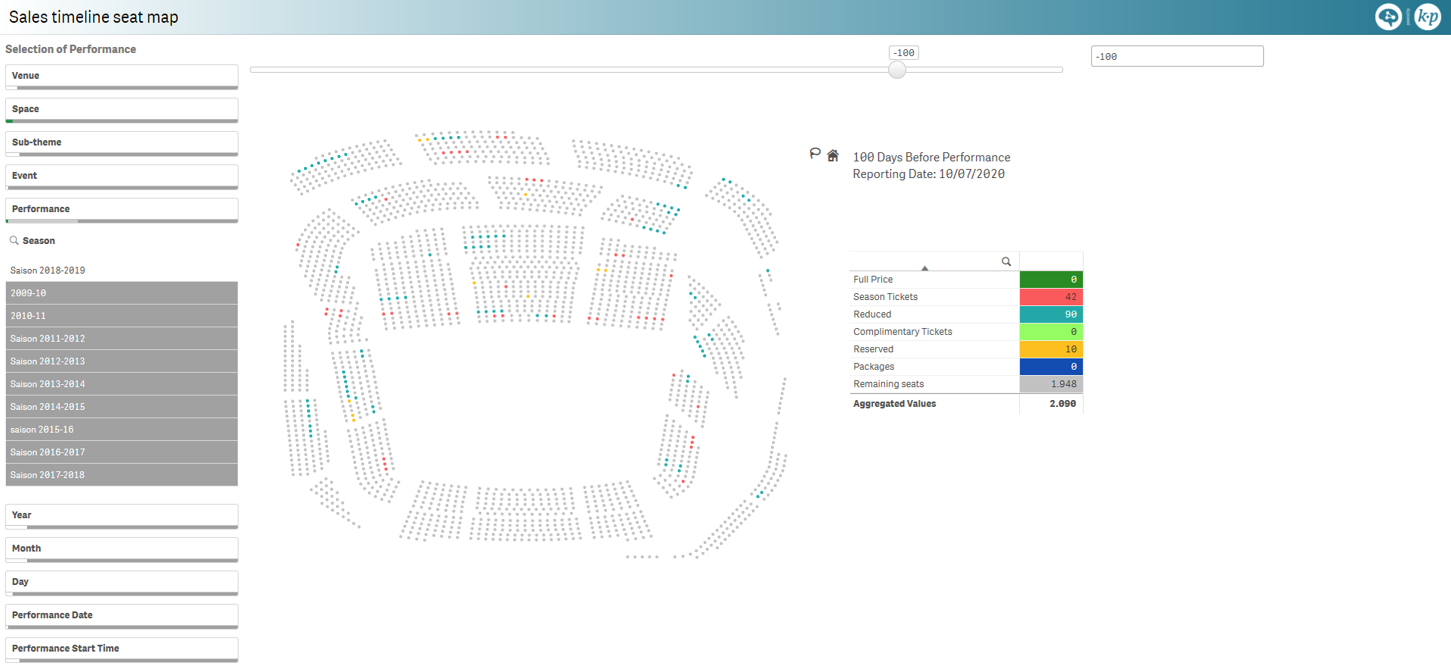
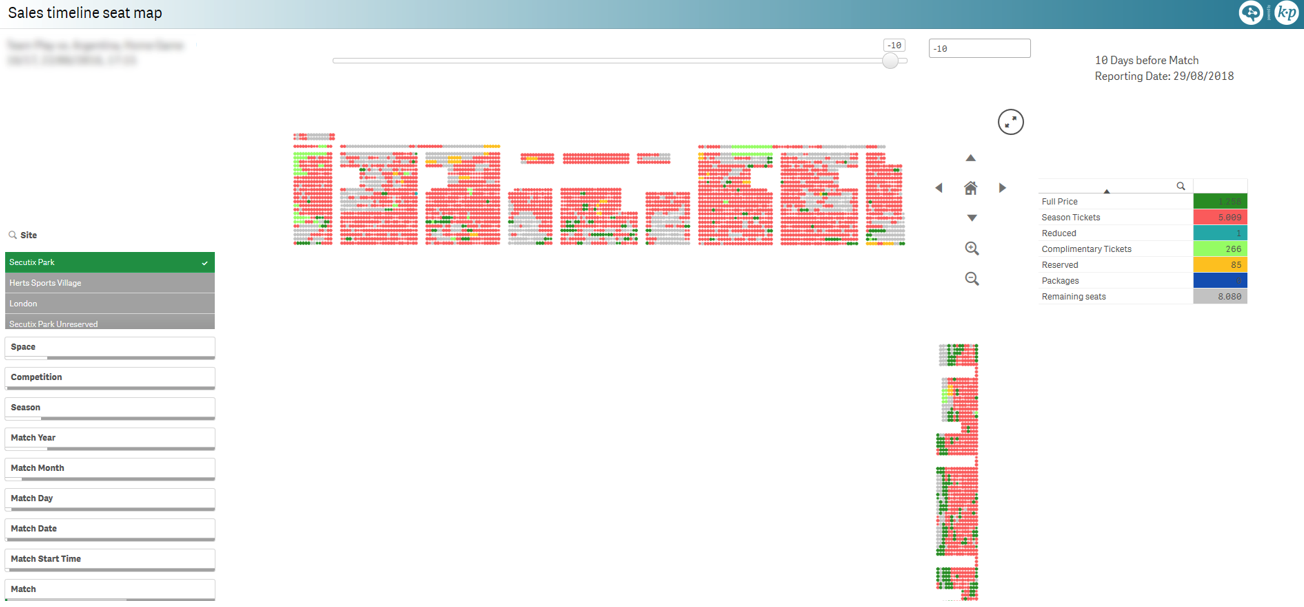
Sales timeline seat map [LE]
Seat map view of the sales status for a given performance and at a given point in time, color coded by:
- Type of tickets
- Full price
- Season tickets
- Reduced
- Complementary tickets
- Reserved
- Packages
- Remaining seats
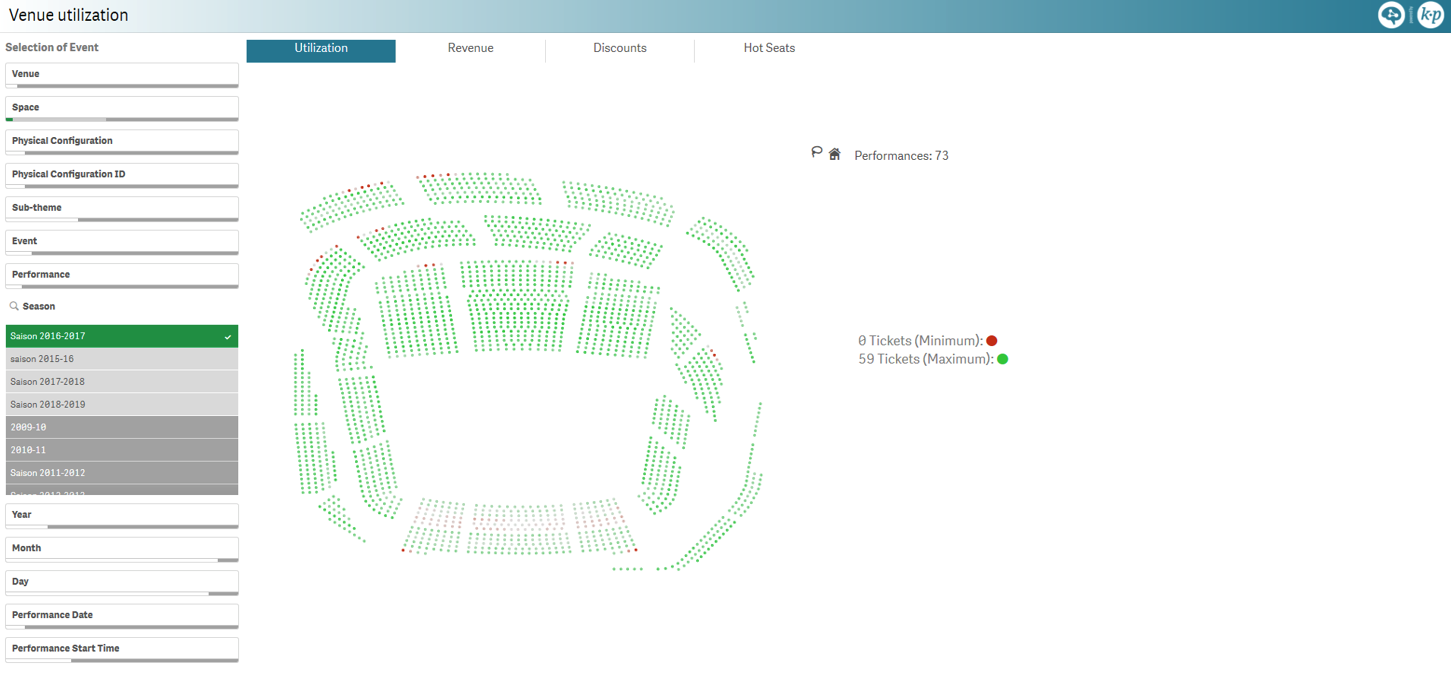
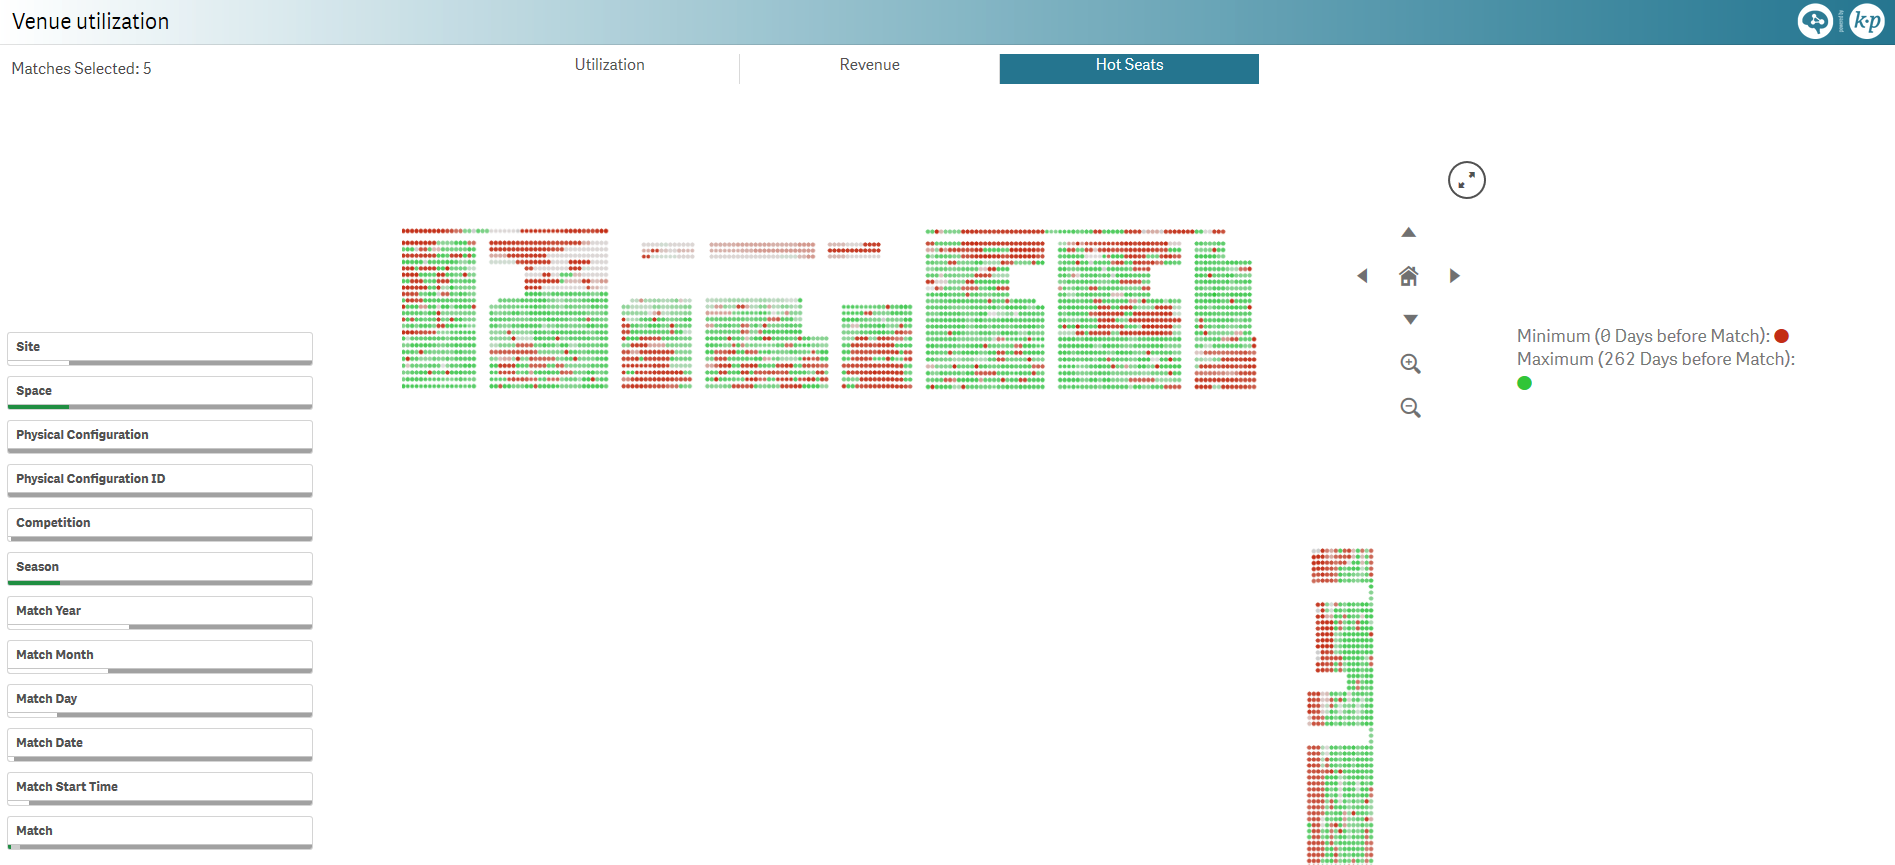
Venue utilization [LE]
Map view of a venue color coded by:
- Utilization: how often a seat is sold
- Revenue: how much revenue a seat generates
- Hot seats: how early a seat is sold
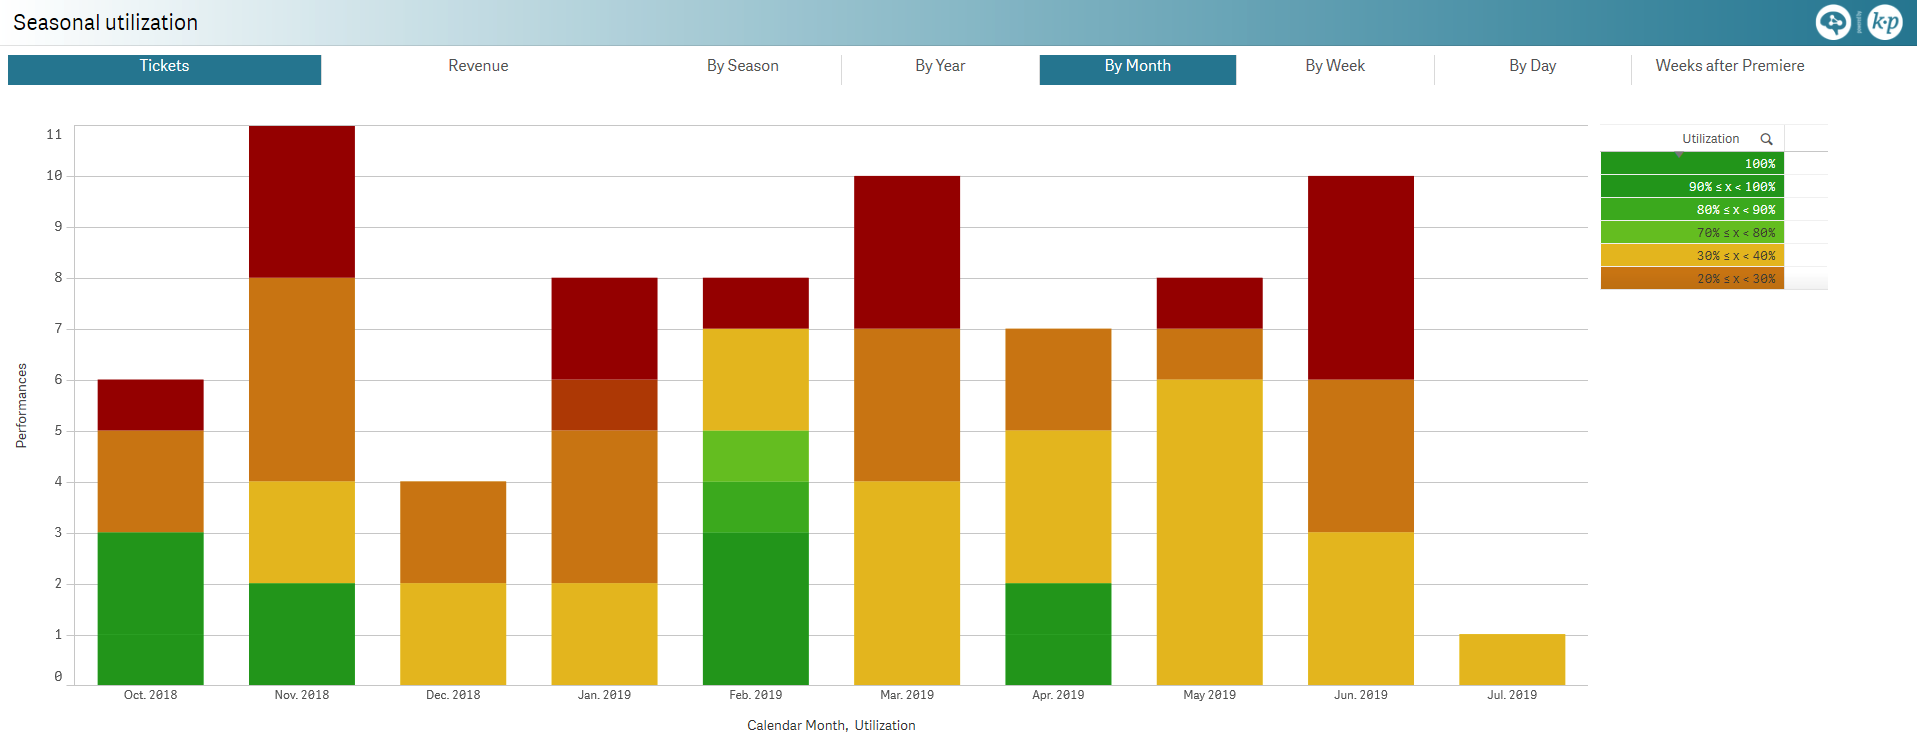
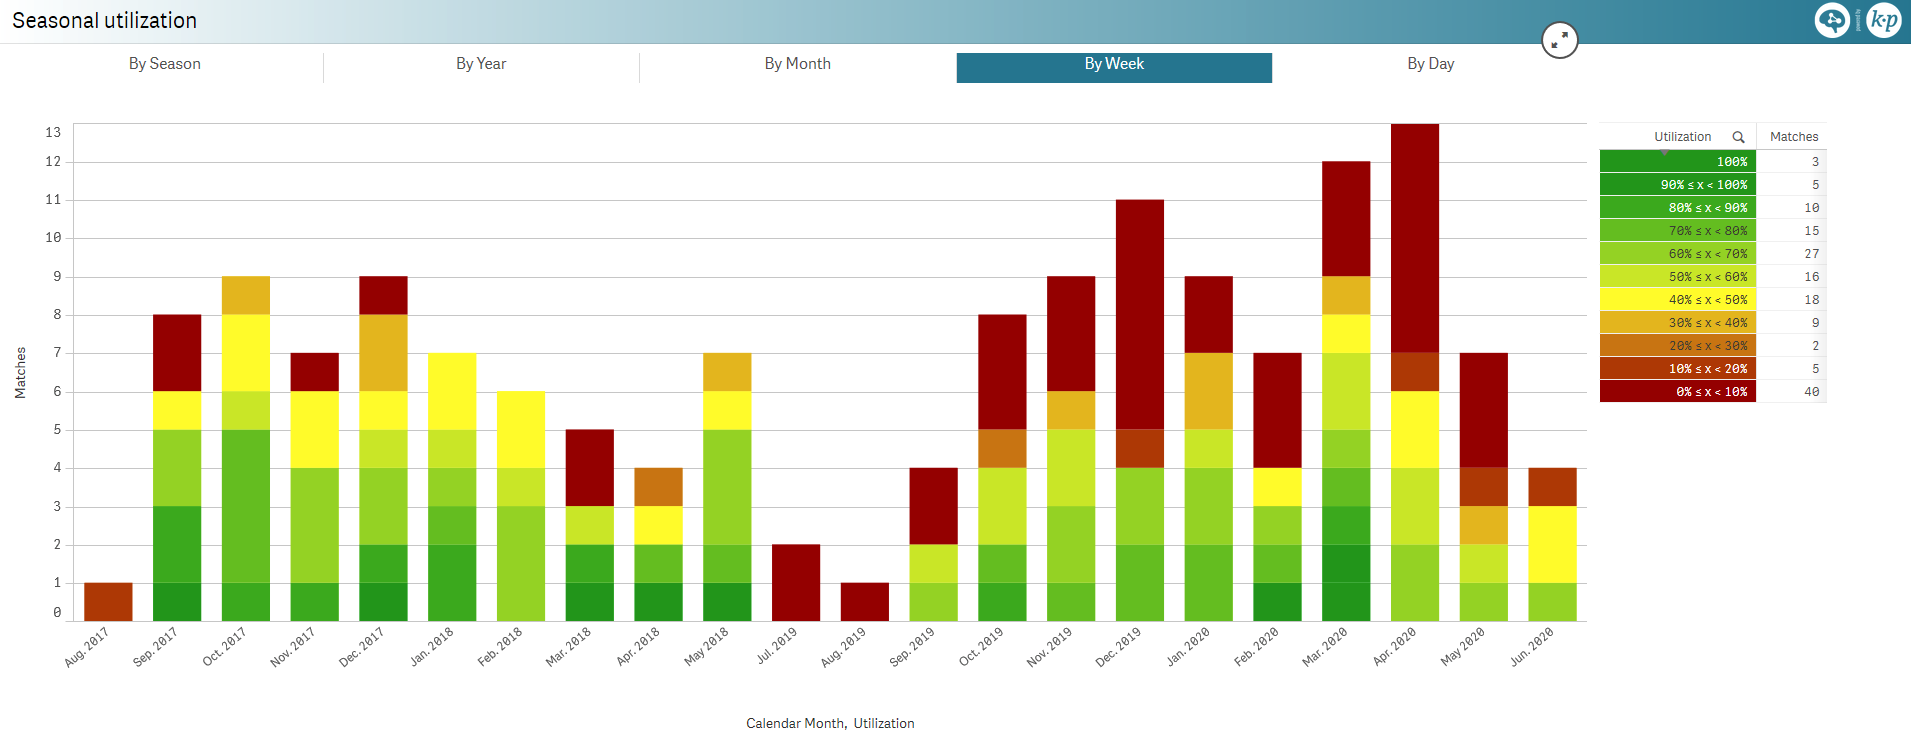
Seasonal utilization [LE]
Performance capacity and financial utilization distributed either per:
- Season
- Year
- Month
- Week
- Day
- Weeks after premier
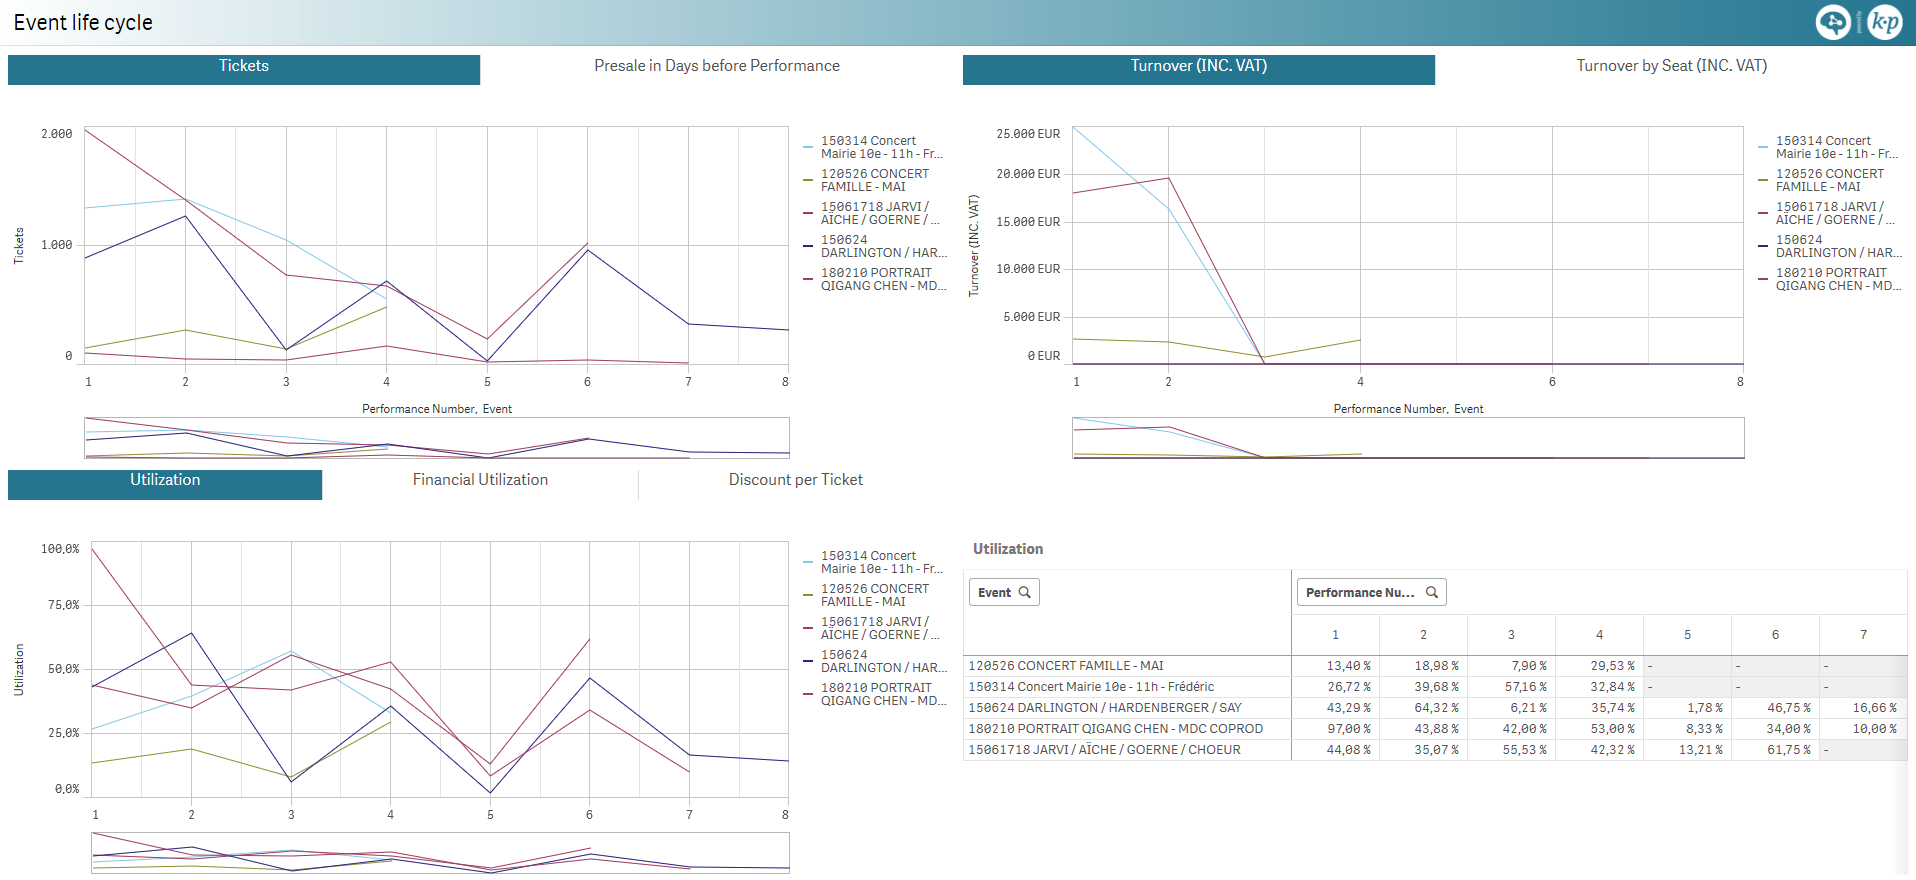
Event life cycle [LE]
Comparison of events by performance number with respect to either:
- Number of sold tickets
- Sales date relative to performance date
- Revenue
- Revenue per seat
- Capacity utilization
- Financial utilization
- Discount per ticket
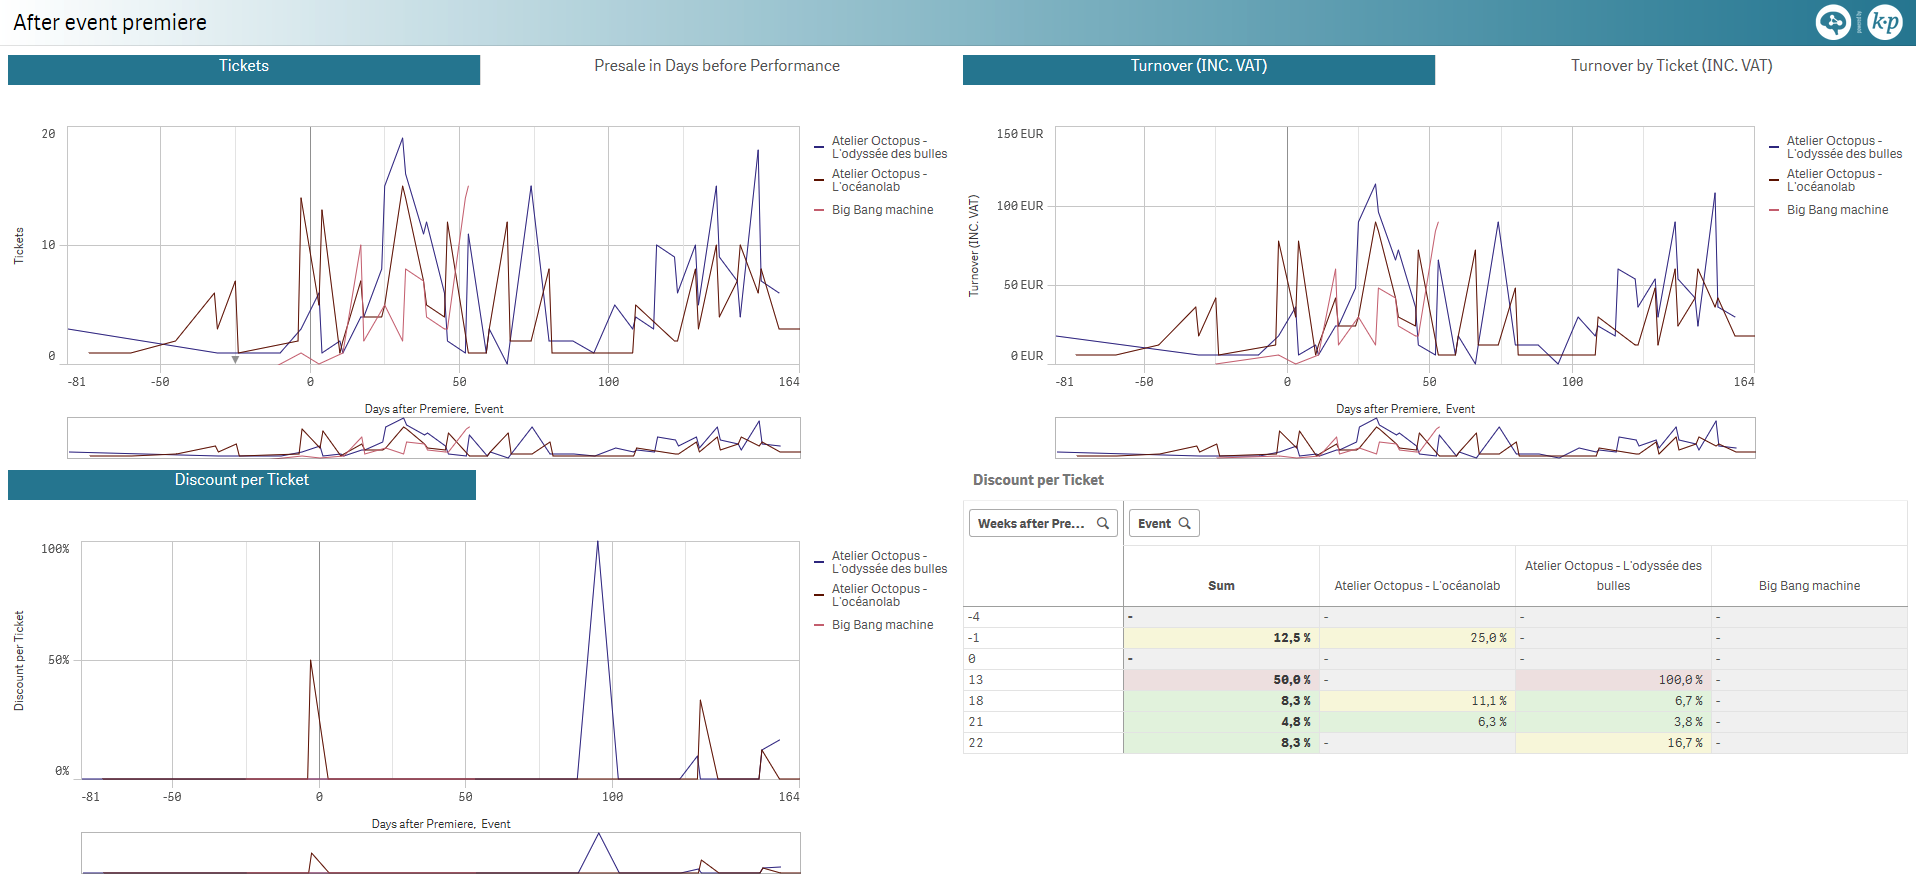
After event premiere [LE]
Comparison of events by days after the premier with respect to either:
- Number of sold tickets
- Sales date relative to performance date
- Revenue
- Revenue per seat
- Discount per ticket
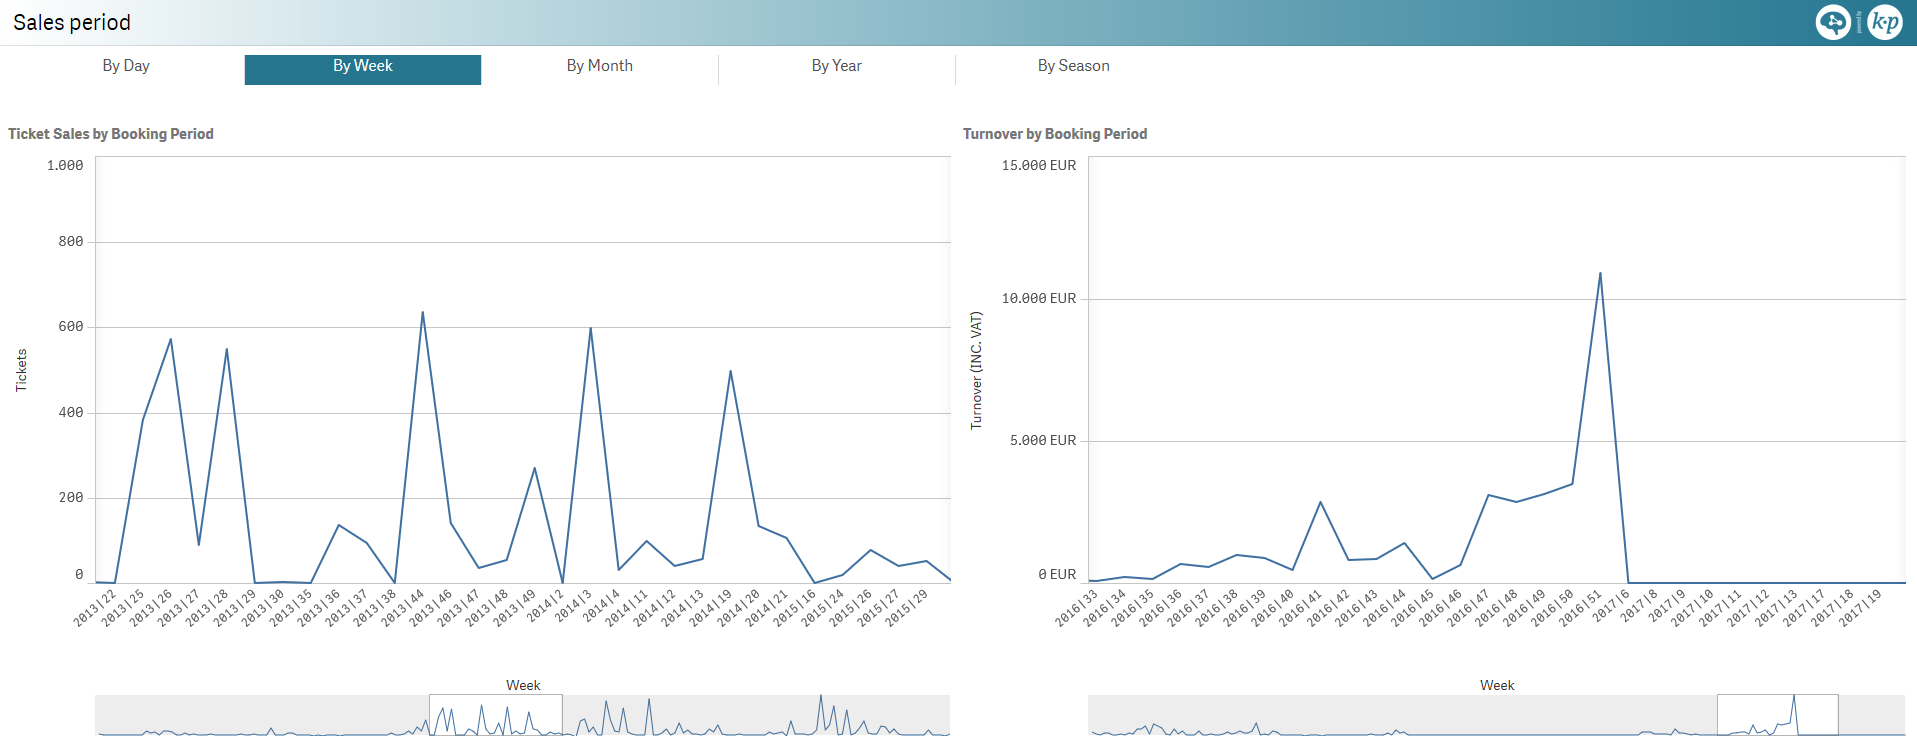
Sales period [LE]
Sold tickets and revenue by either:
- Day
- Week
- Month
- Season
- Year
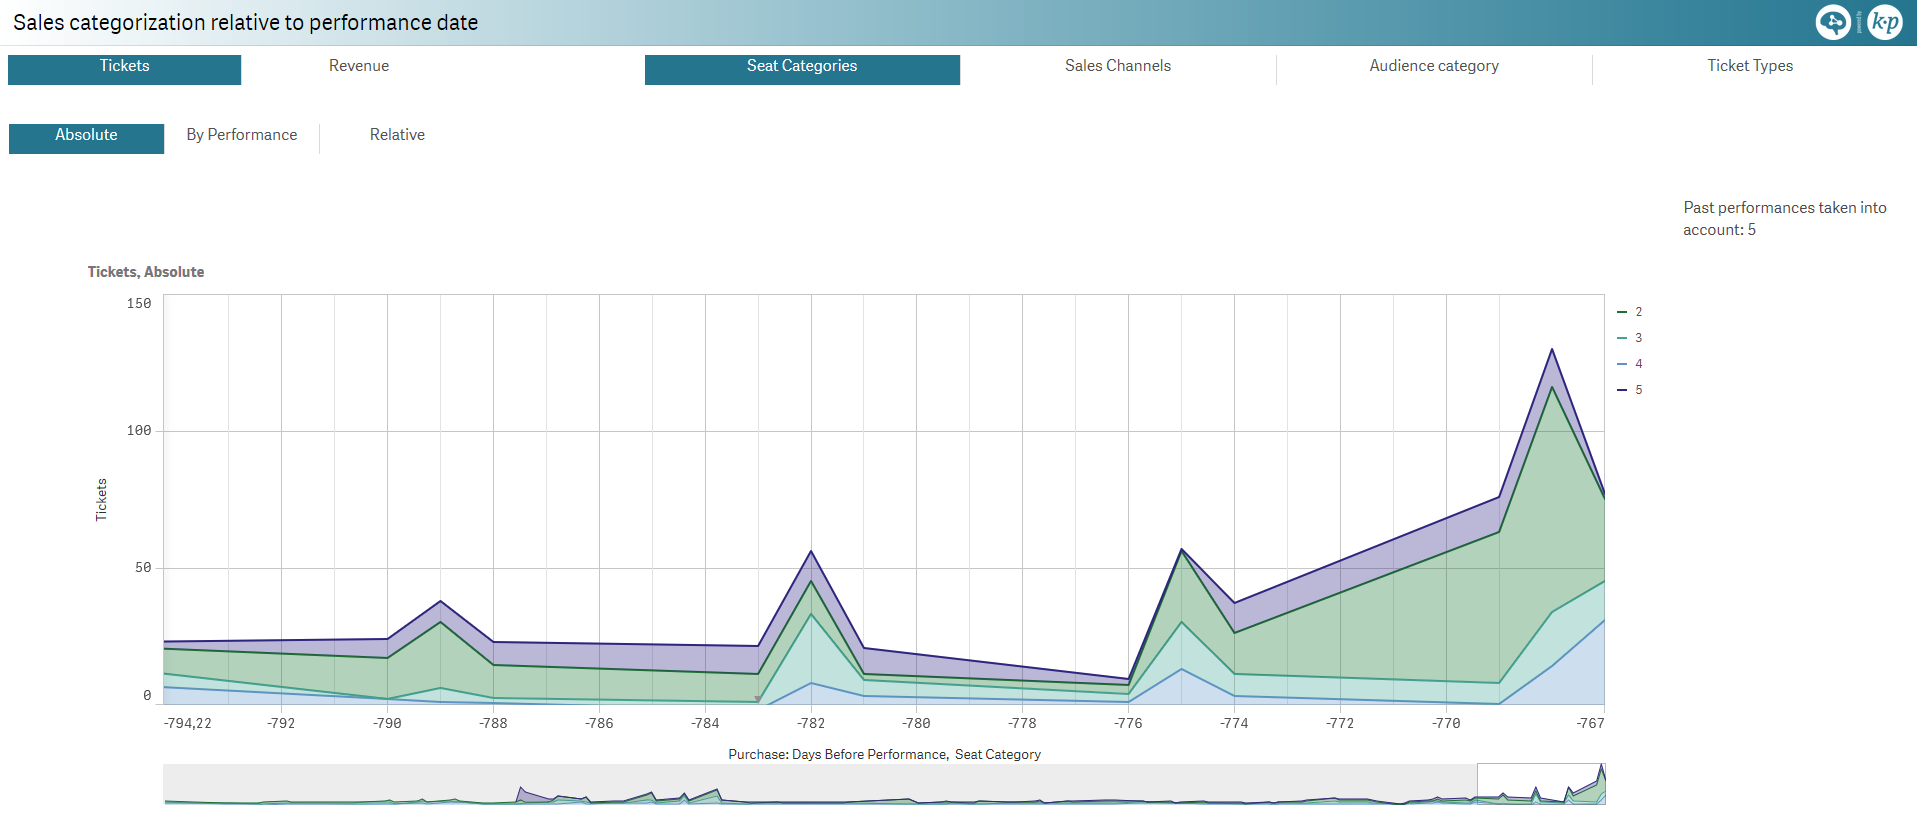
Sales categorization relative to performance date [LE]
Sold tickets and revenue, totals and per performance, comparison in days before the performance, split by:
- Seat category
- Sales channel
- Audience category
- Ticket type (tariff)
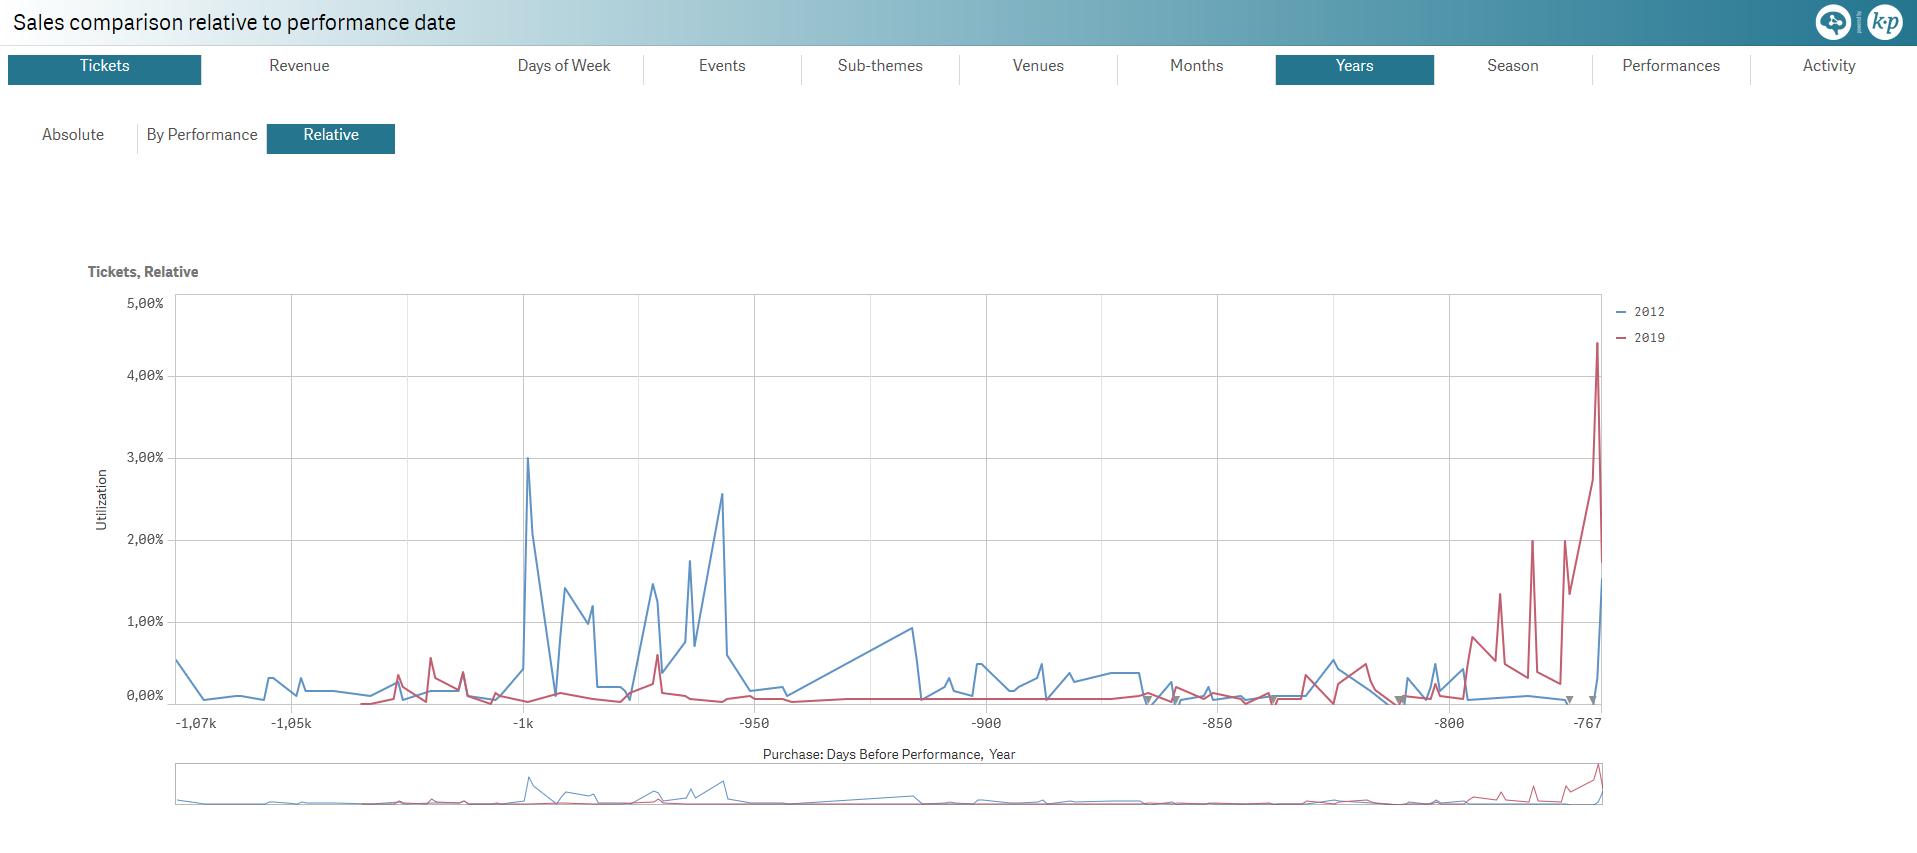
Sales comparison relative to performance date [LE]
Sold tickets and revenue, absolute and per performance, comparison in days before the performance, split by:
- Day of the week of the performance
- Event
- Sub-theme
- Venue
- Month of performance
- Year of performance
- Season
- Performance
- Activity
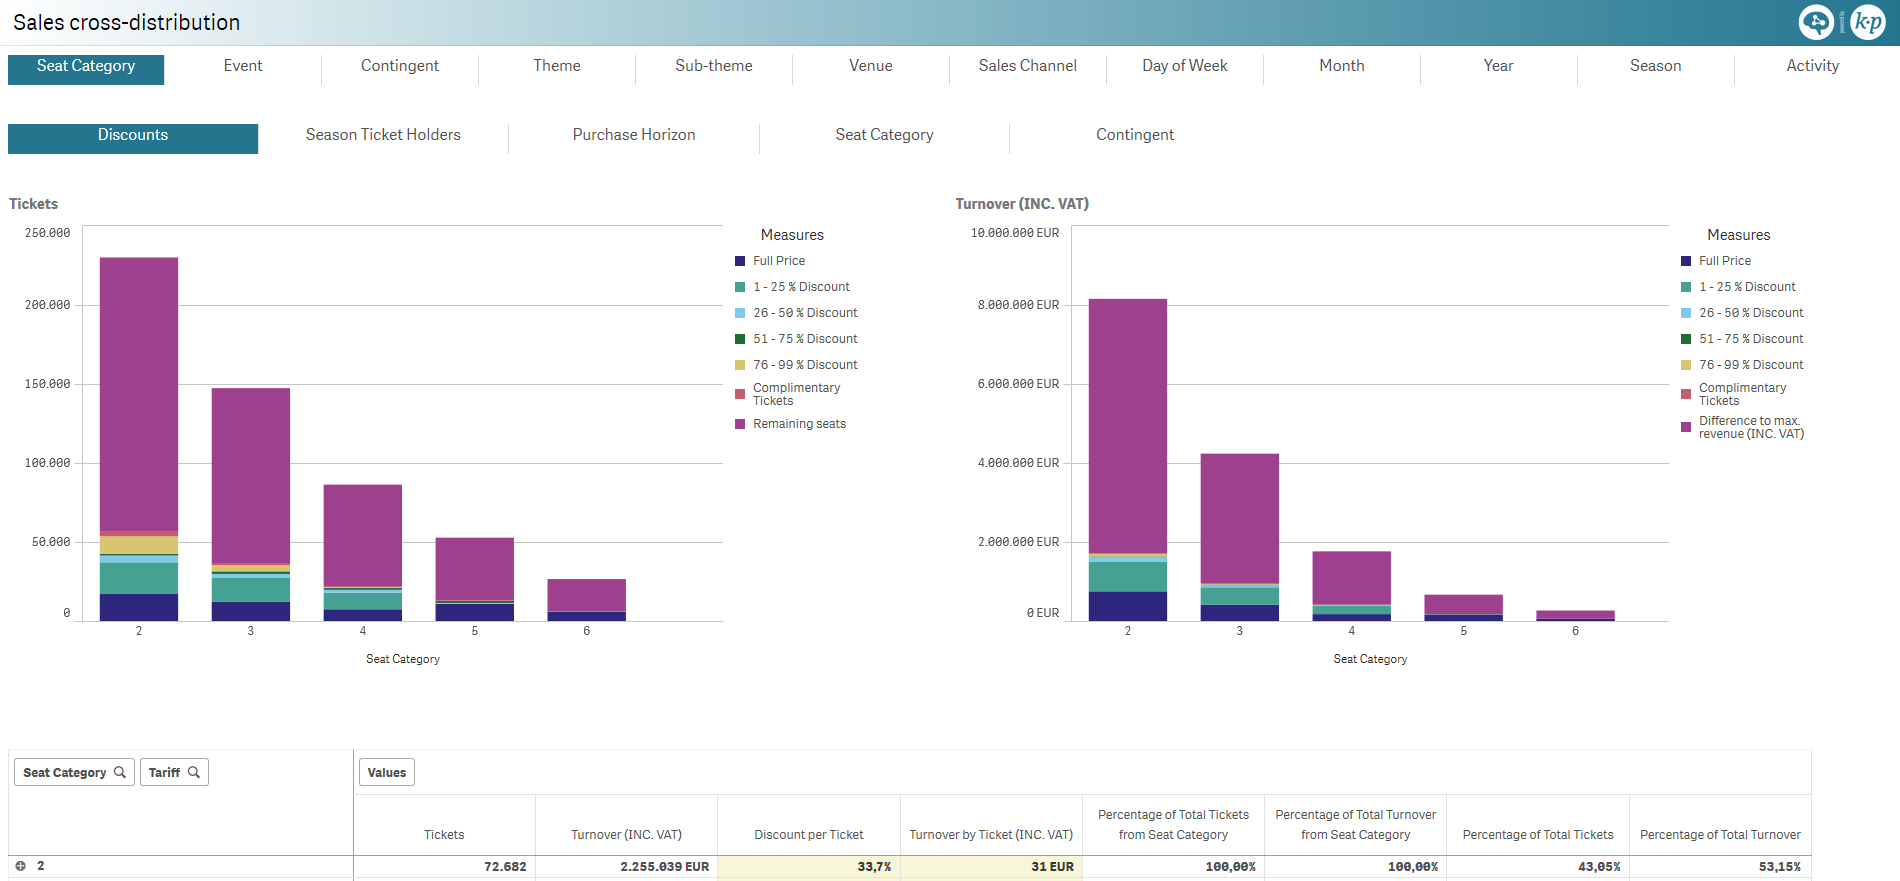
Sales cross-distribution [LE]
Sold tickets and revenue:
| distributed per | and split by |
|---|---|
|
|
Pivot table for the selected dimension and the following measures:
- Number of sold tickets
- Revenue
- Discount per ticket
- Revenue per ticket
- Percentage of total tickets of the selected dimension
- Percentage of revenue of the selected dimension
- Percentage of total tickets
- Percentage of revenue
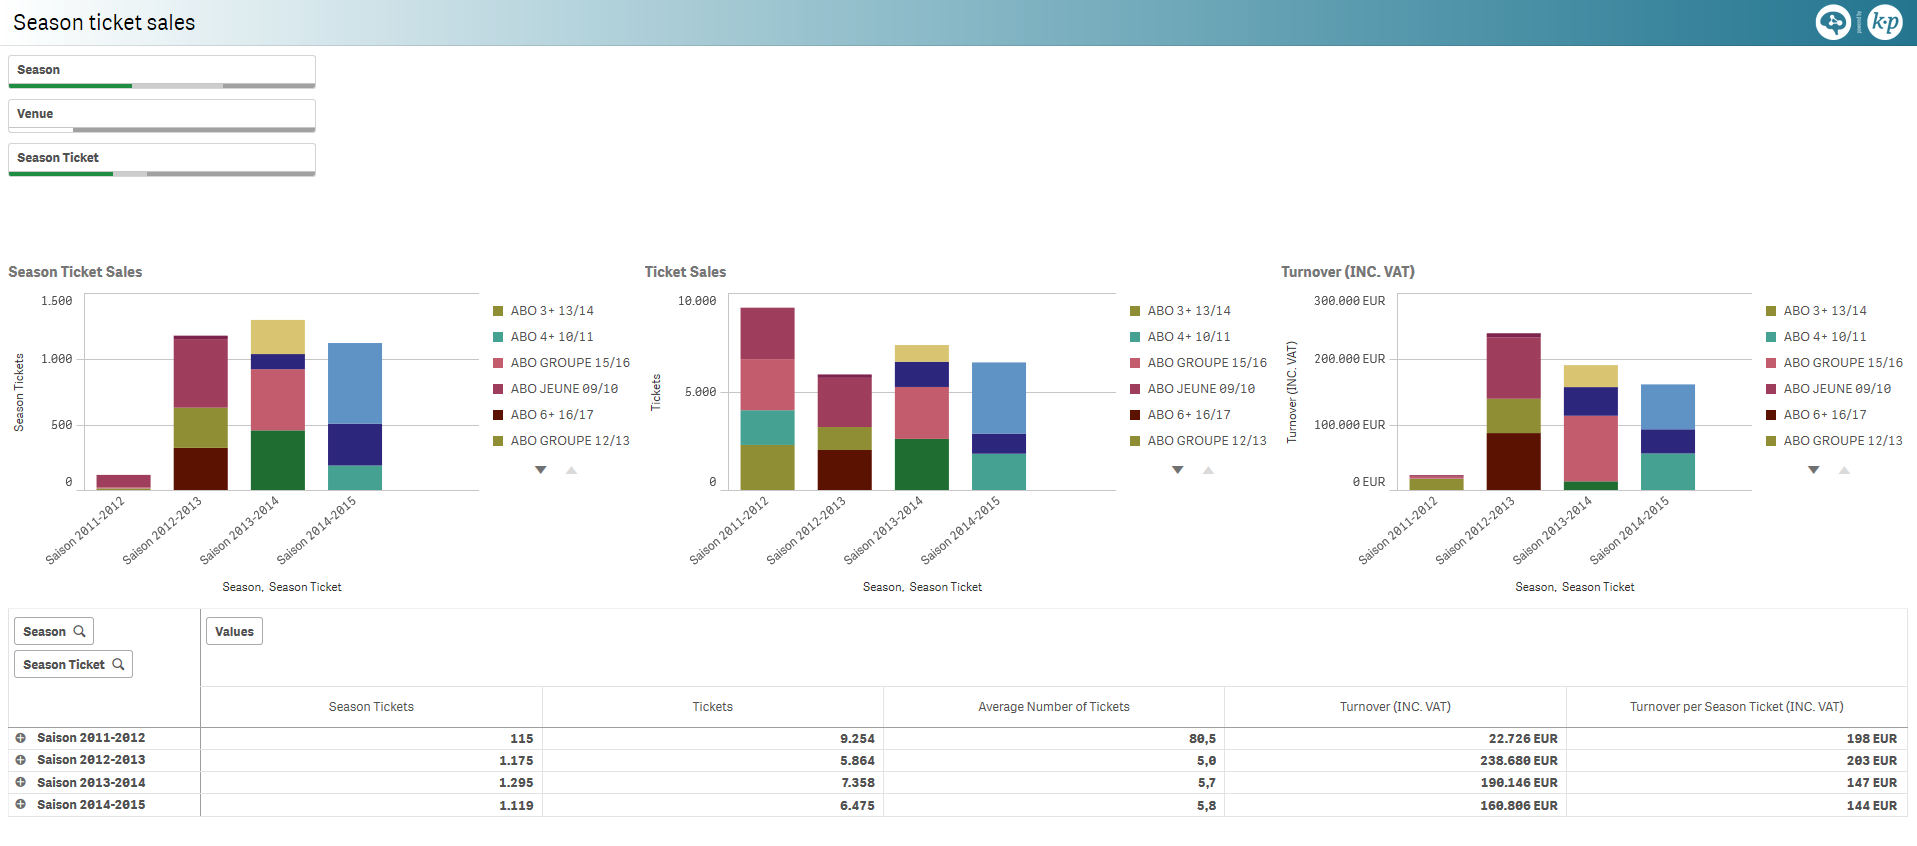
Season ticket sales [LE]
Season ticket sales, sold tickets within a season ticket and revenue distributed per:
- season
Pivot table by season and season ticket for the following measures:
- Number of season tickets
- Number of tickets sold within a season ticket
- Average number of tickets sold per season ticket
- Revenue
- Revenue per season ticket
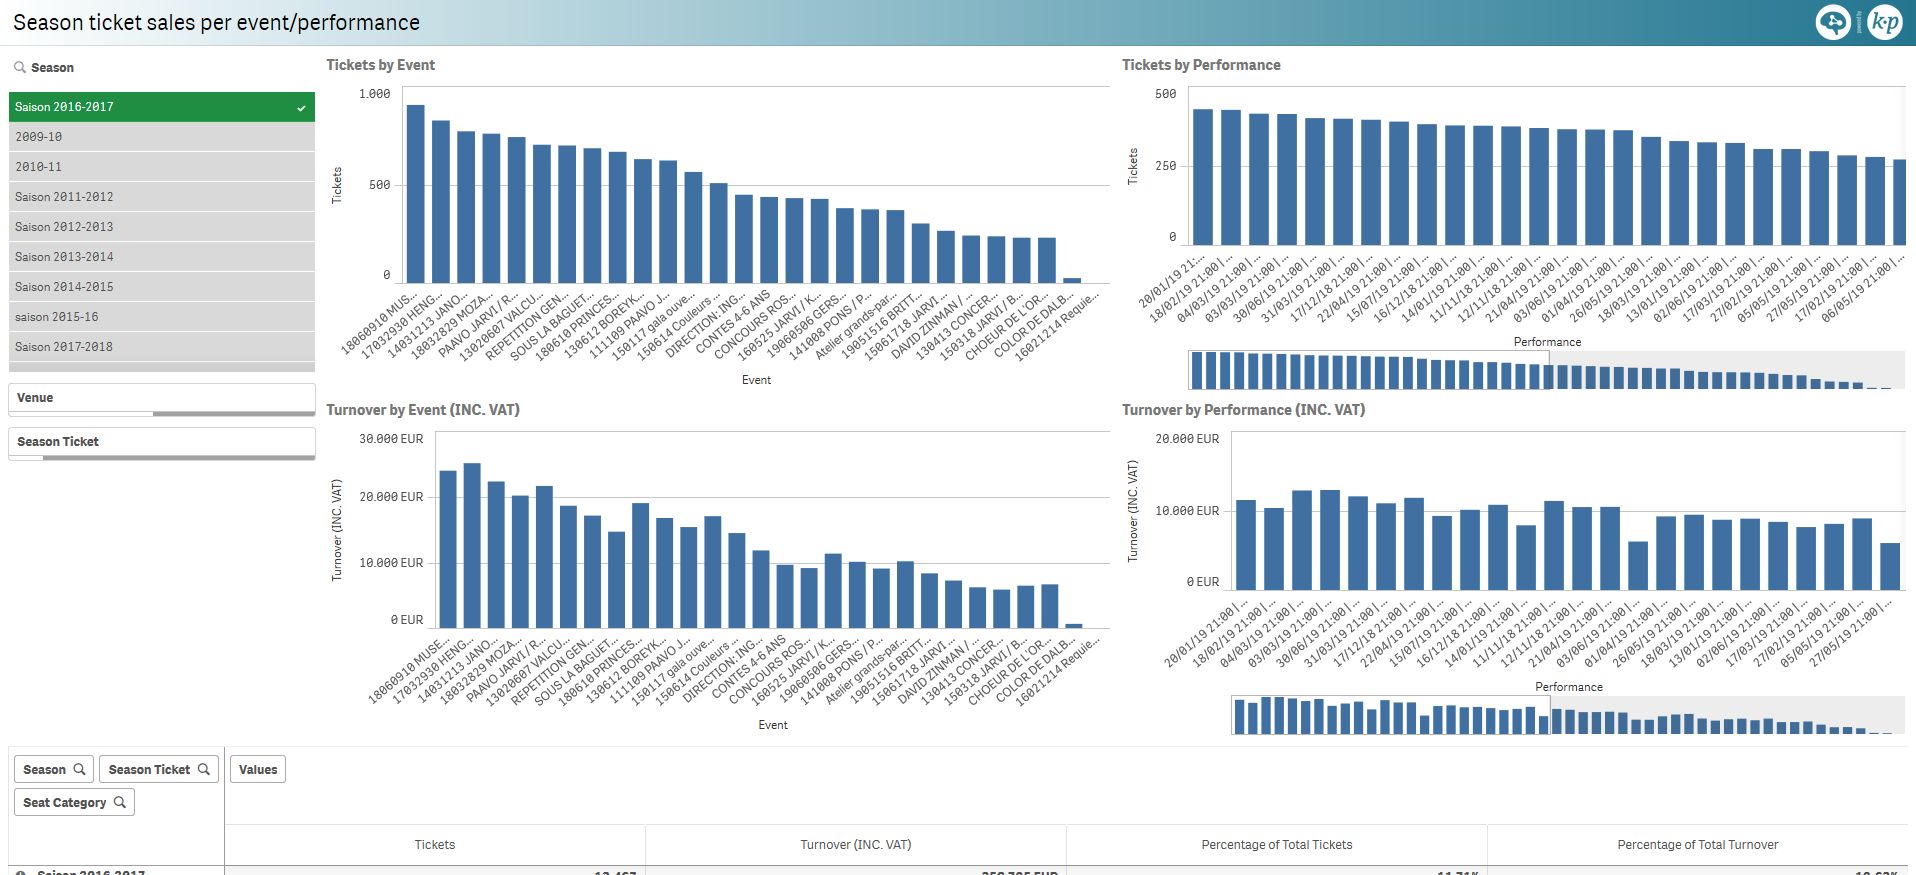
Season ticket sales per event/performance [LE]
Season ticket sales and revenue distributed per:
- event
- performance.
Pivot table by season, season ticket and seat category for the following measures:
- Number of tickets sold within a season ticket
- Revenue
- Percentage of sold tickets per seat category
- Percentage of revenue per seat category
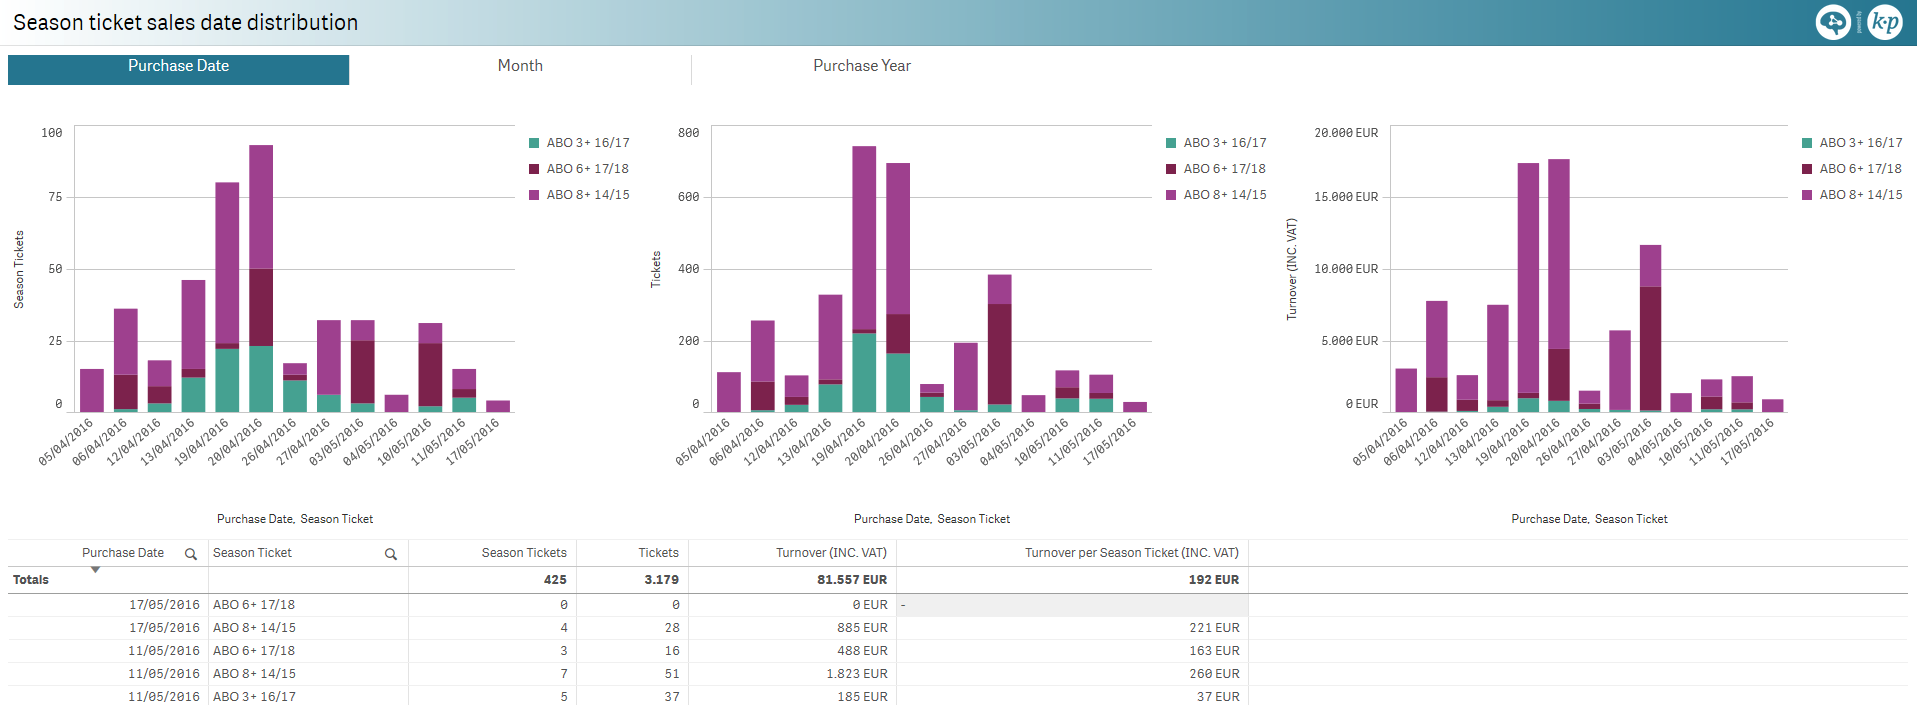
Season ticket sales date distribution [LE]
Season ticket sales, sold tickets within a season ticket and revenue distributed per:
- Purchase date
- Month of purchase
- Year of purchase
Pivot table by season ticket for the following measures:
- Number of season tickets
- Number of tickets sold within a season ticket
- Revenue
- Revenue per season ticket
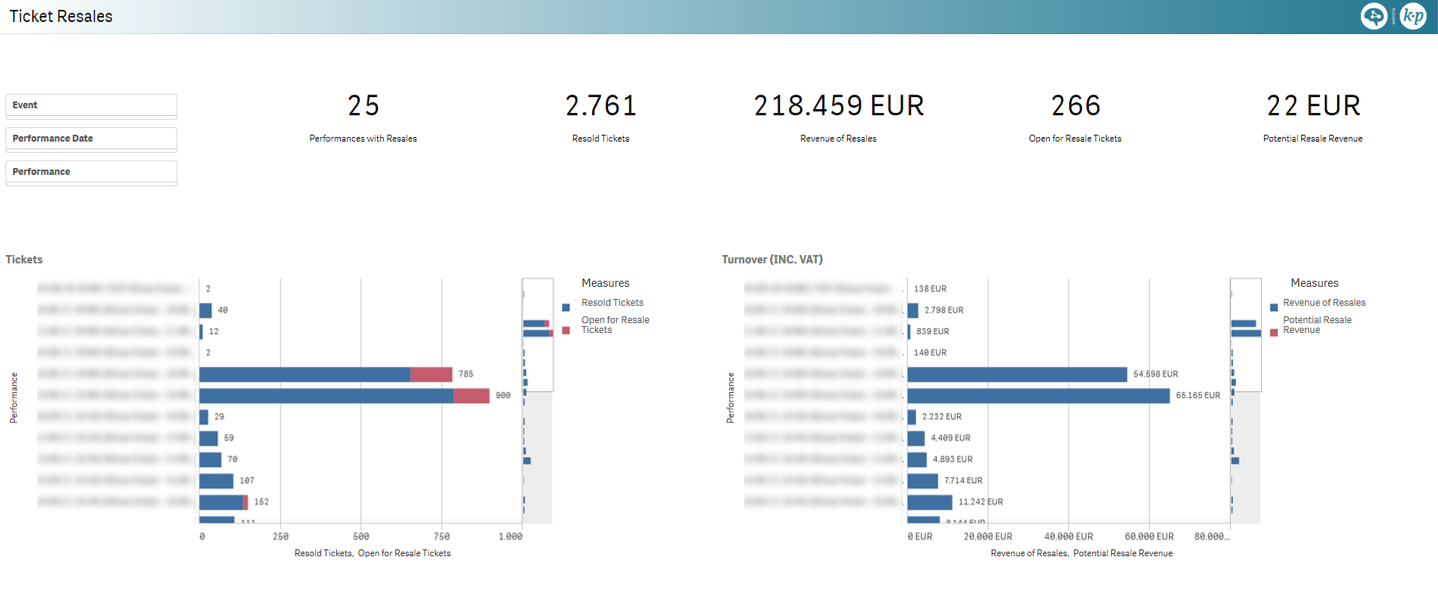
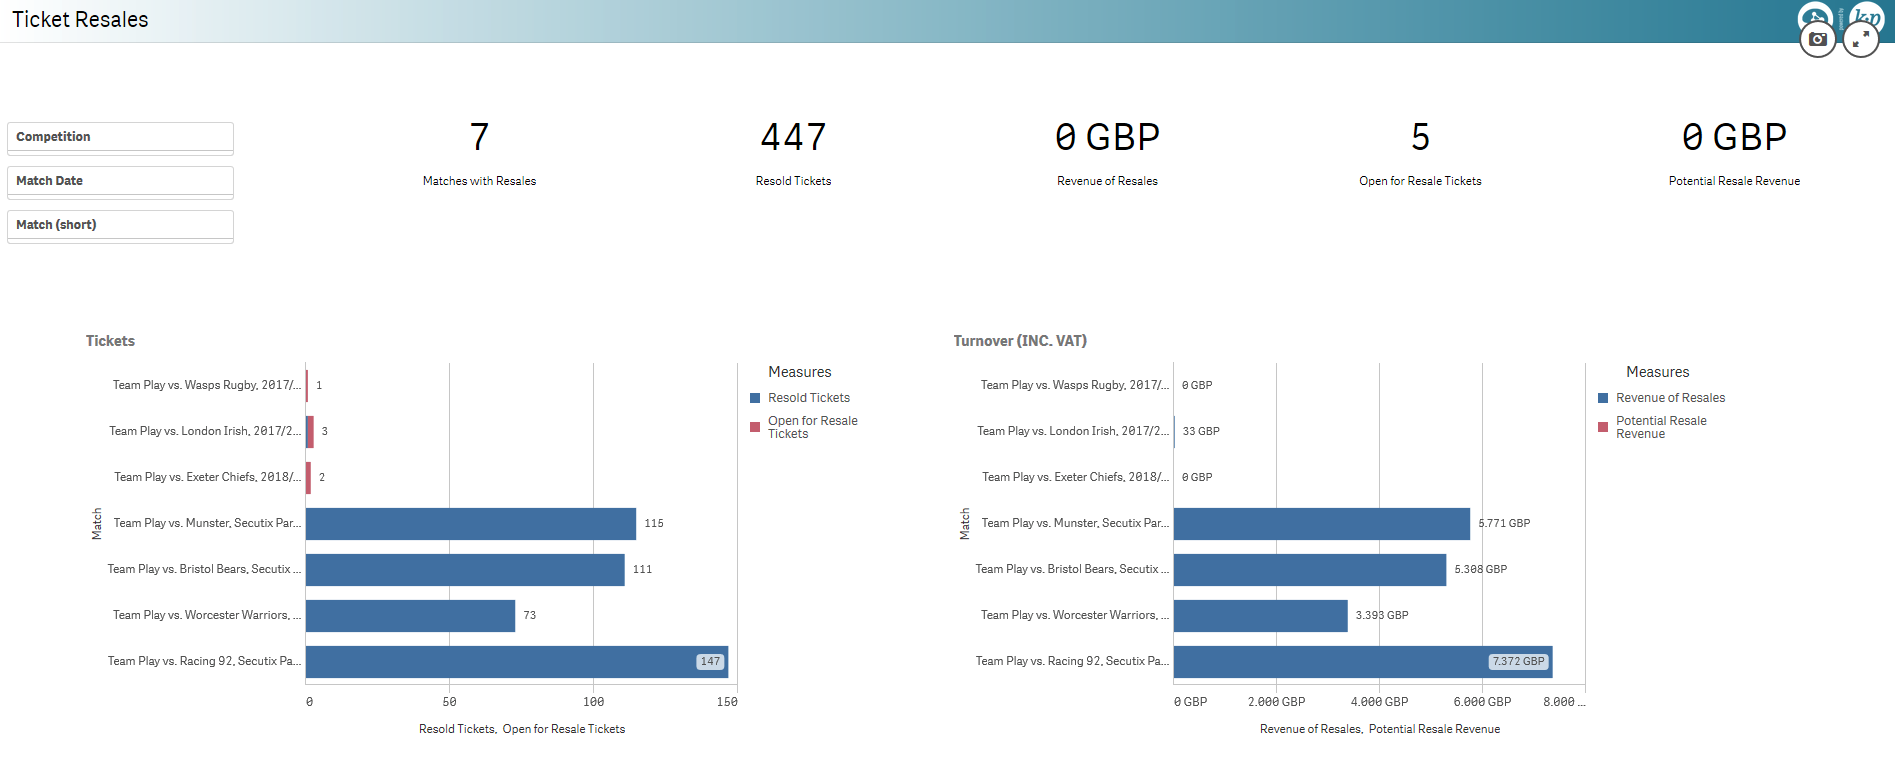
Ticket Resales [LE]
Resales KPI:
- Number of matches with resales
- Number of resold tickets
- Revenue of resales
- Number of tickets available for resales
- Potential resales revenue
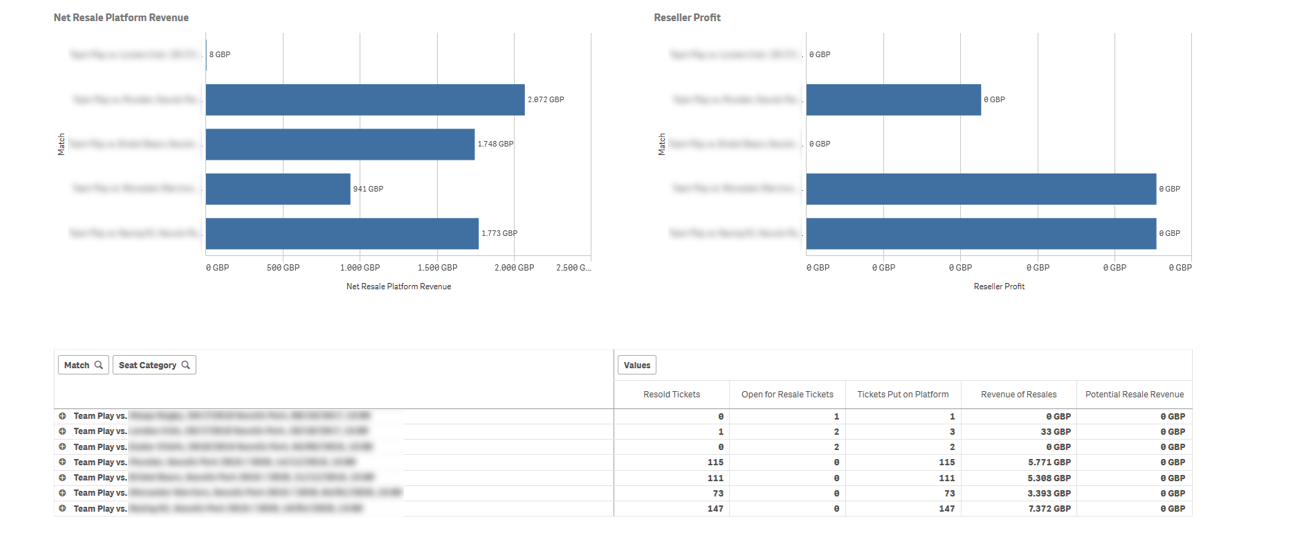
Resold tickets, resales revenue, net resale platform revenue and reseller profit distributed per match.
Pivot table by match and seat category the following measures:
- Number of resold tickets
- Number of tickets available for resales
- Total number of resales tickets
- Revenue of resales
- Potential resales revenue
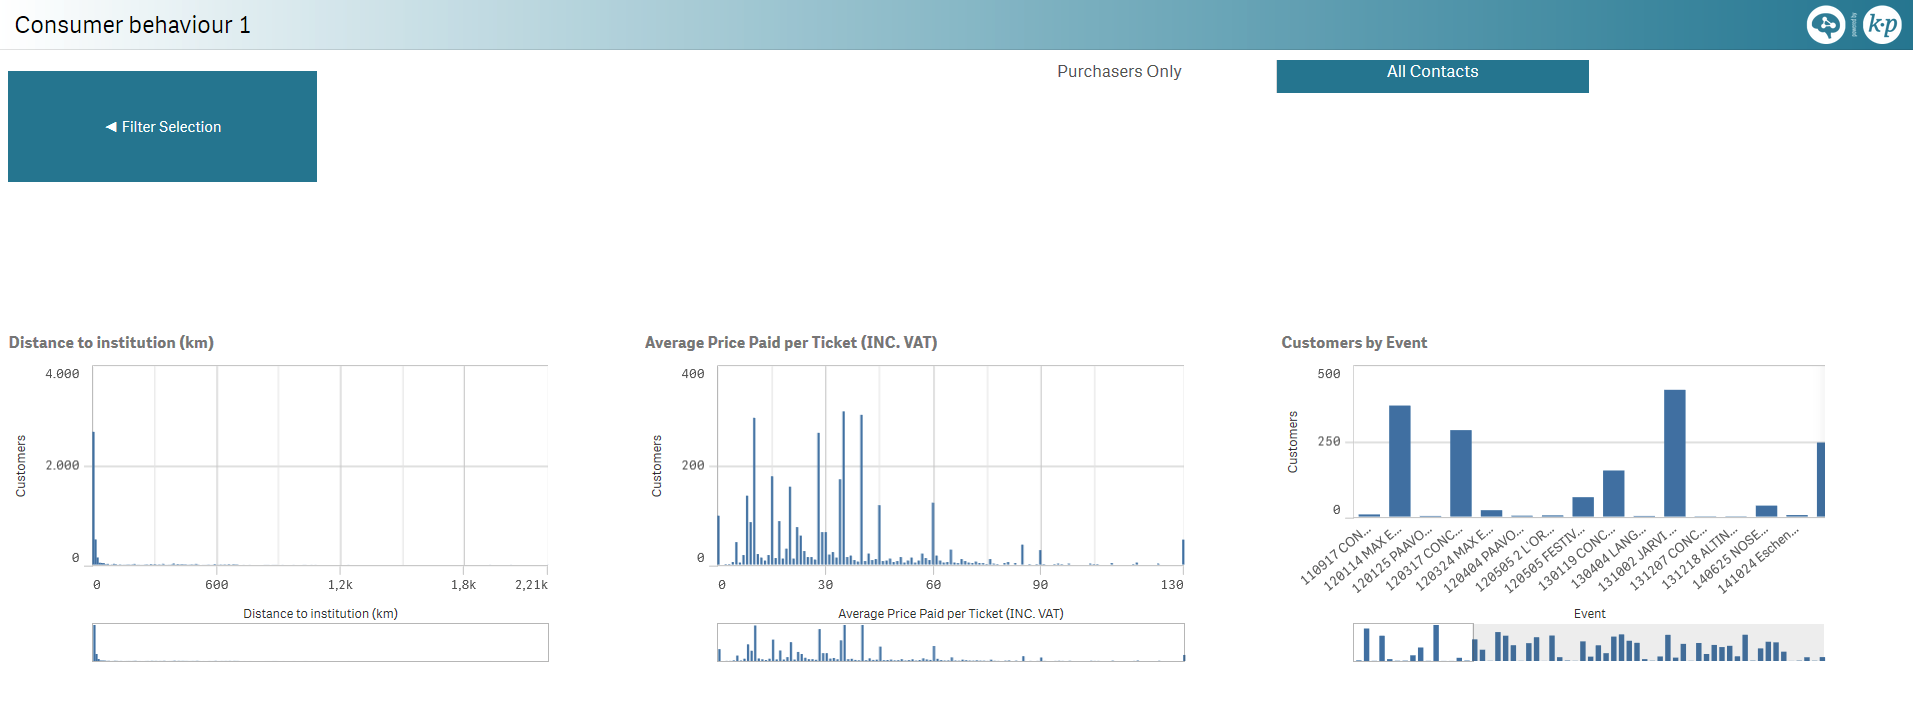
Consumer behaviour 1 [LE]
Customers and total contacts, which also includes contacts with cancellations, distributed per:
- Distance to institution
- Average price per ticket
- Event
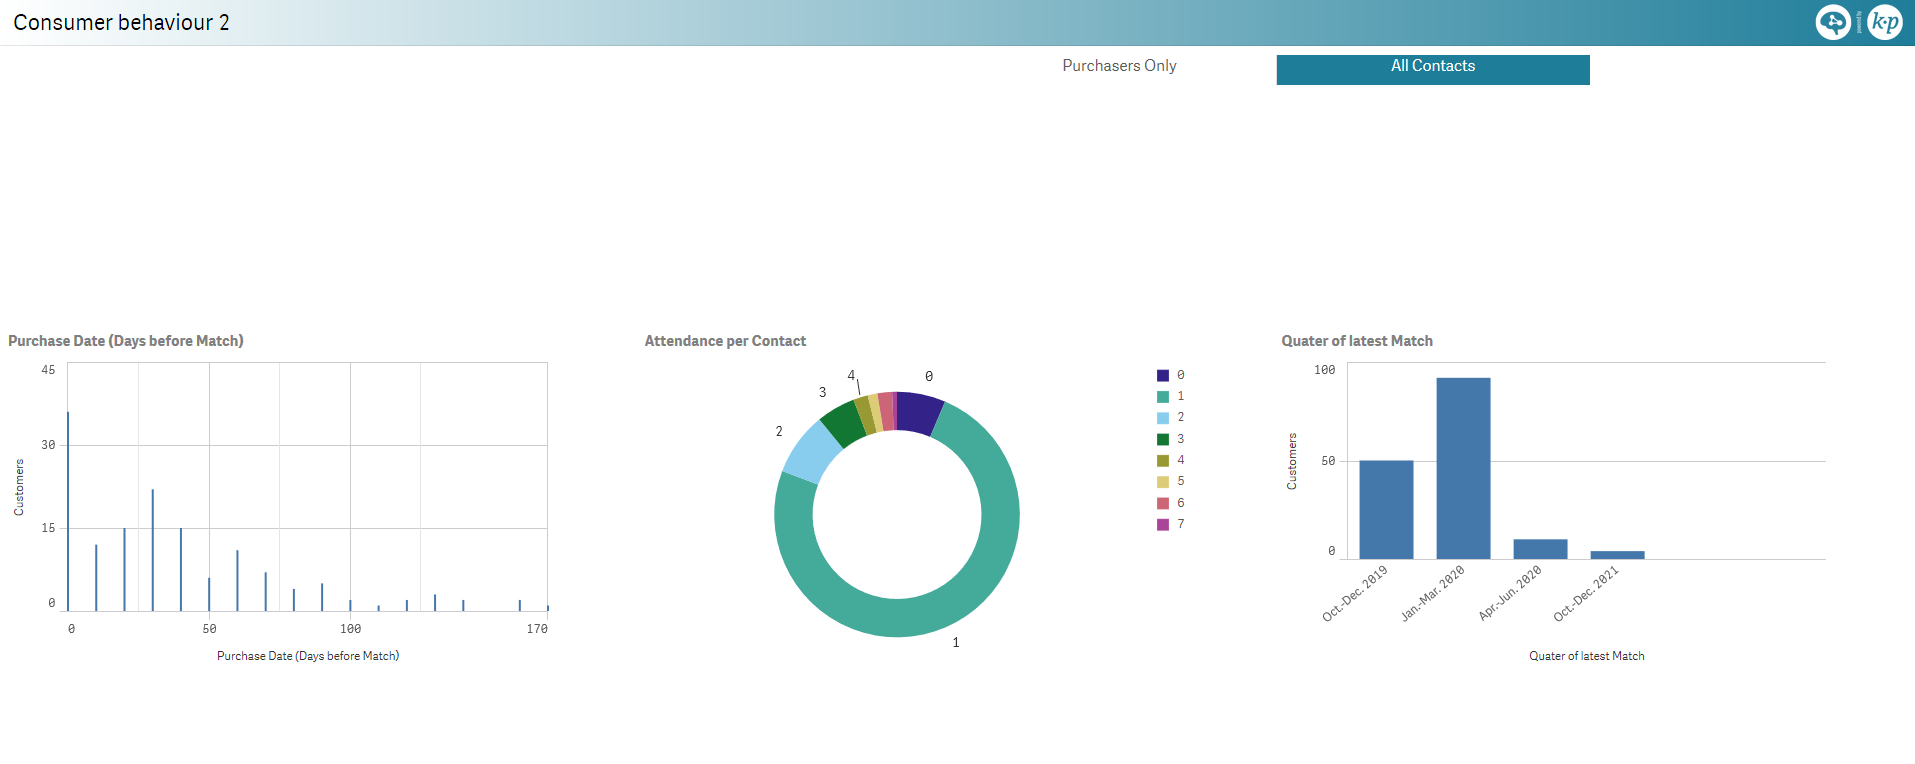
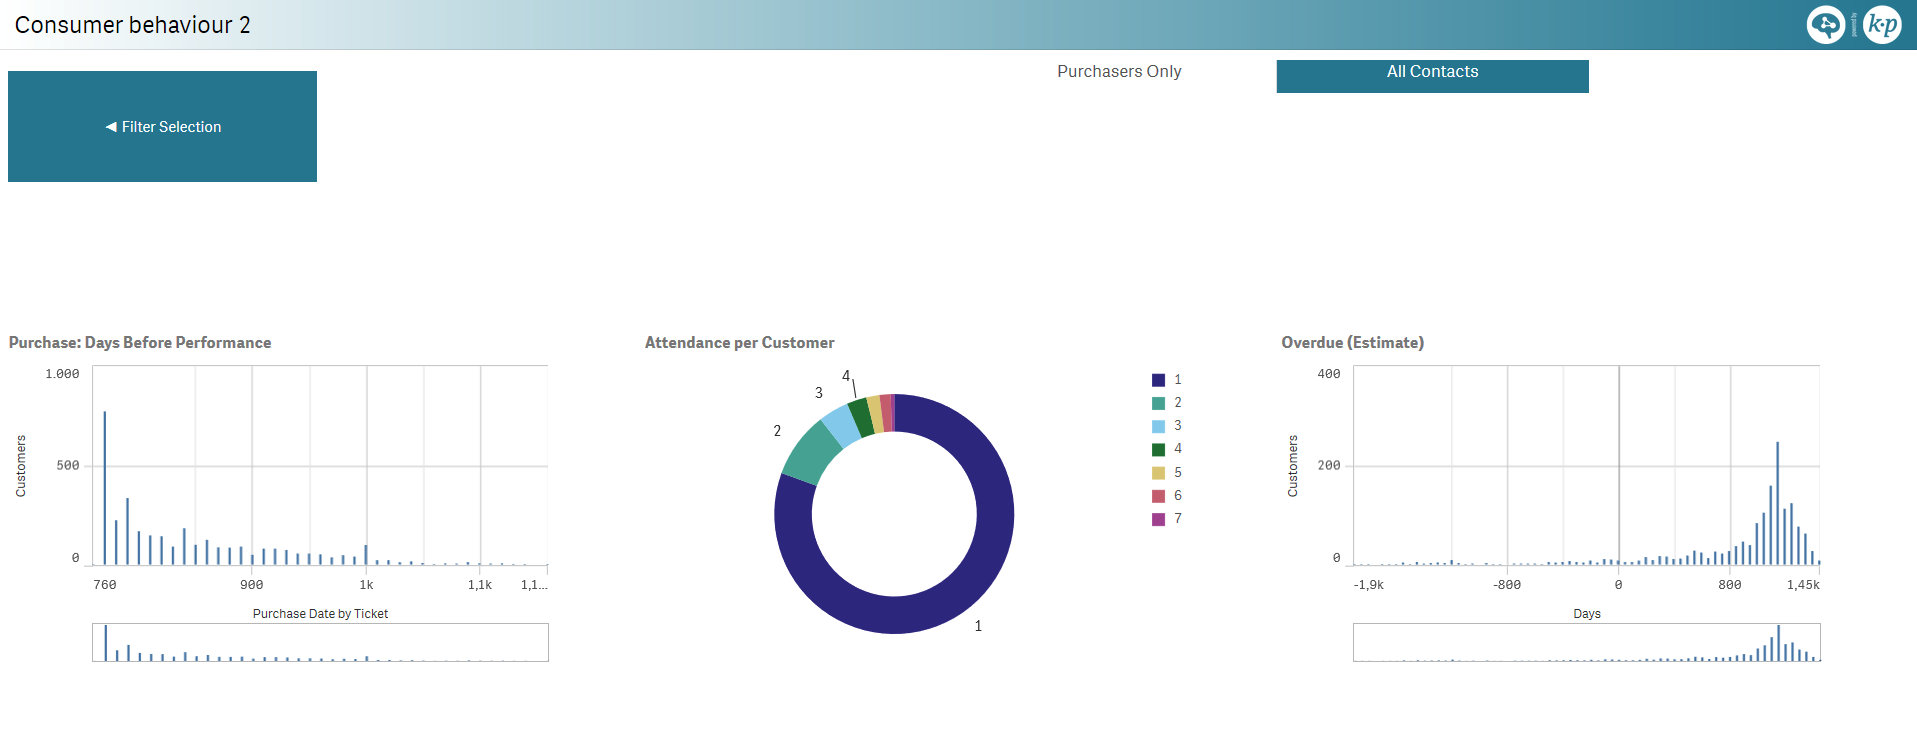
Consumer behaviour 2 [LE]
Customers and total contacts, which also includes contacts with cancellations, distributed per:
- Purchase date relative to the performance date
- Number of attendances
- Overdue estimation, i.e., according to their estimated standard behaviour did they come back earlier (negative value) or later (positive value).
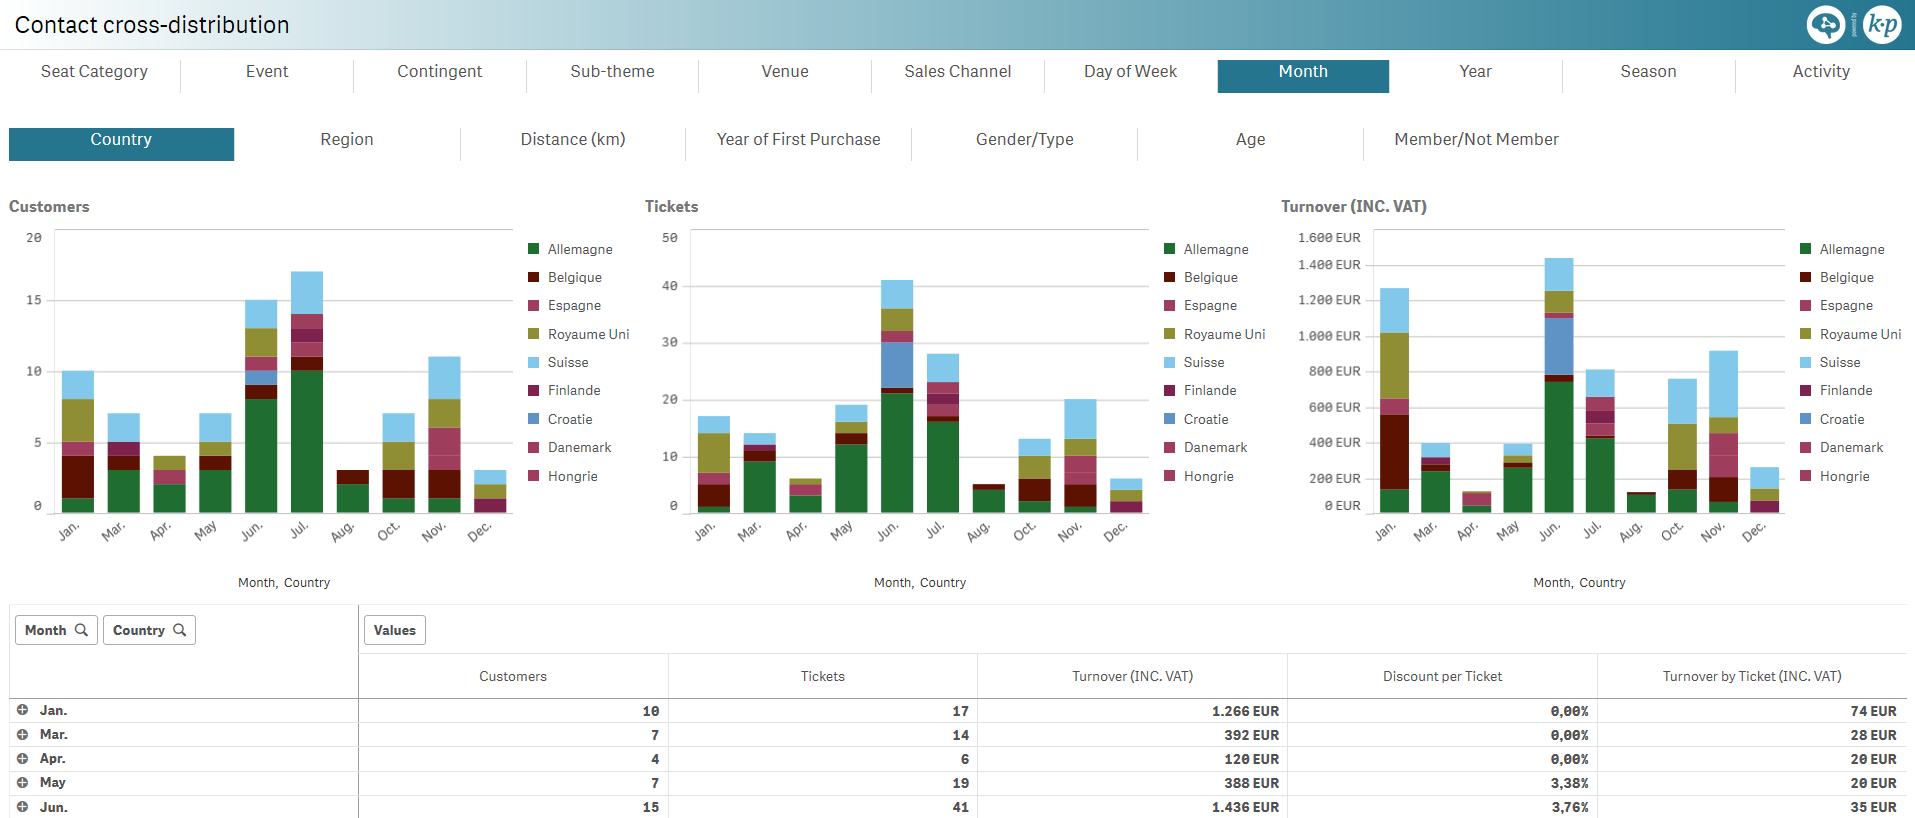
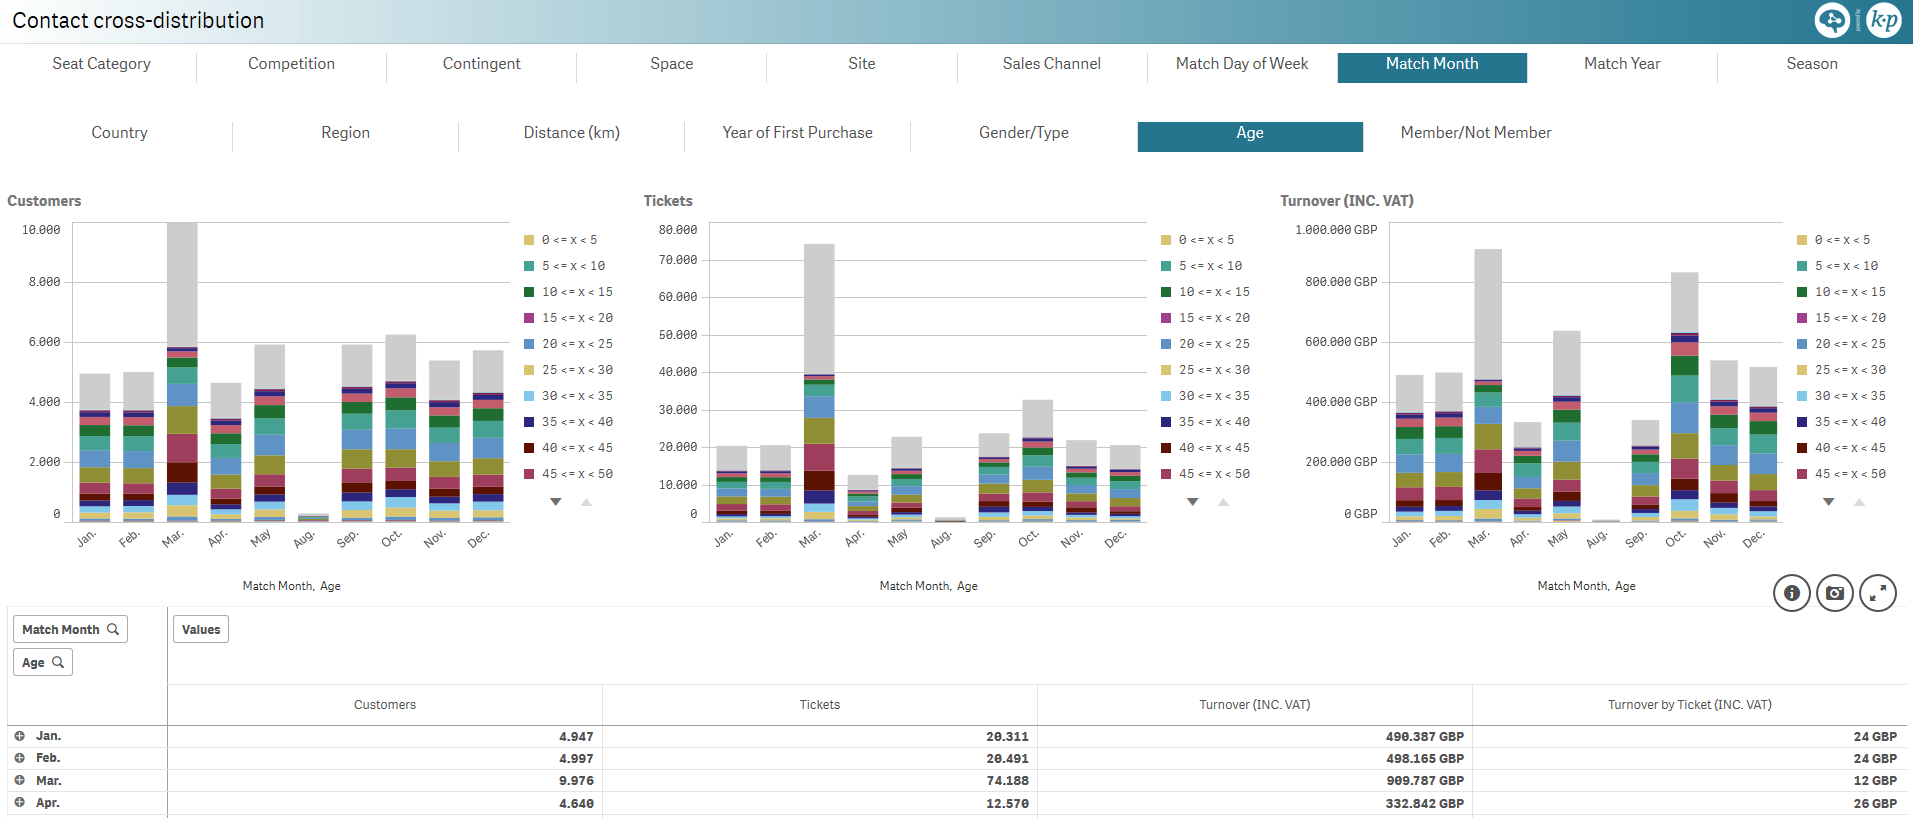
Contact cross-distribution [LE]
Number of customers, sold tickets and revenue
| distributed per | and split by |
|---|---|
|
|
Pivot table for the selected dimensions and the following measures:
- Number of customers
- Number of sold tickets
- Revenue
- Discount per ticket
- Revenue per ticket
MUSEUMS
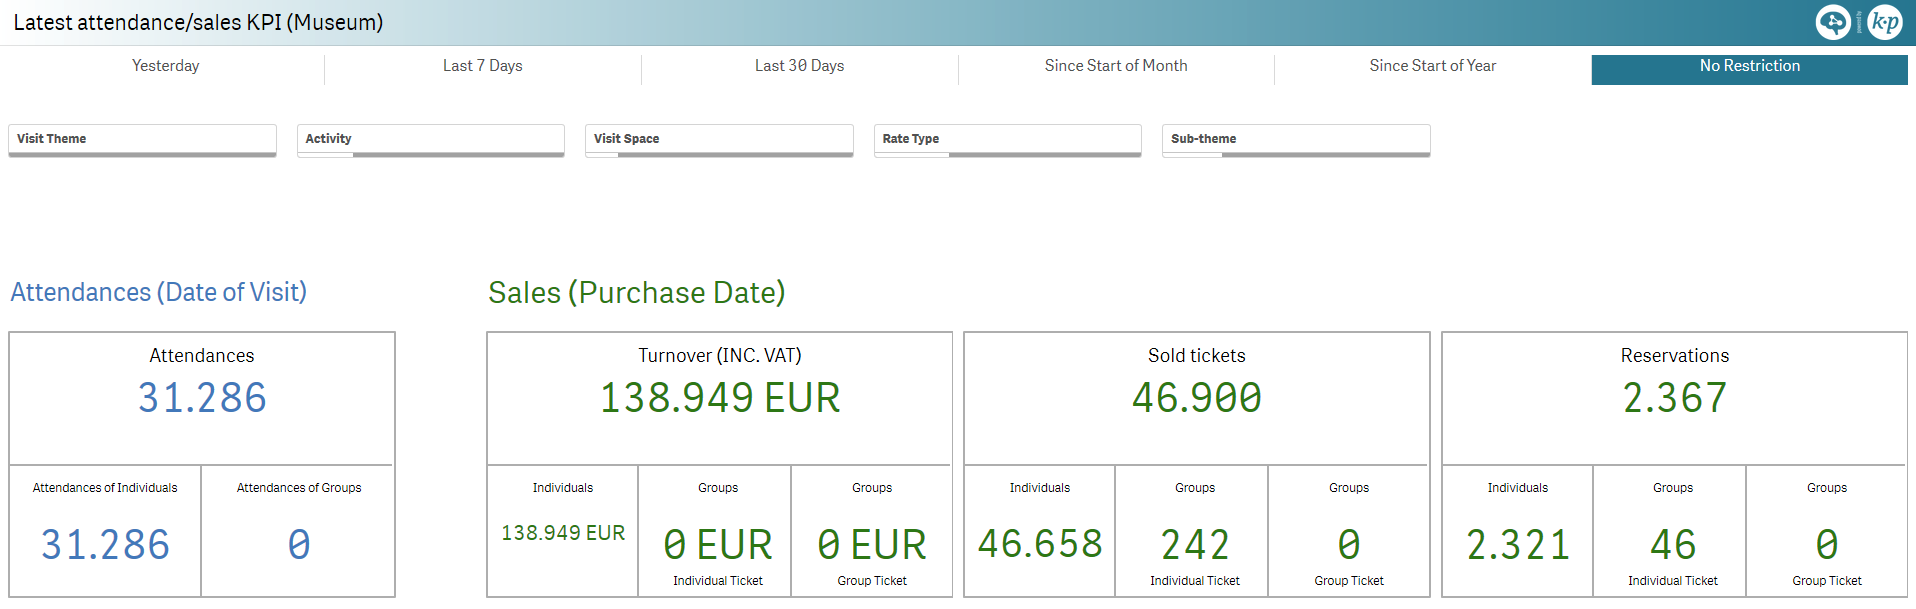
Latest attendance/sales KPI [MU]
KPI for the latest attendance (based on visit date) and sales (based on sales date), split by individuals and groups:
- Attendance
- Revenue
- Number of sold tickets
- Reservations
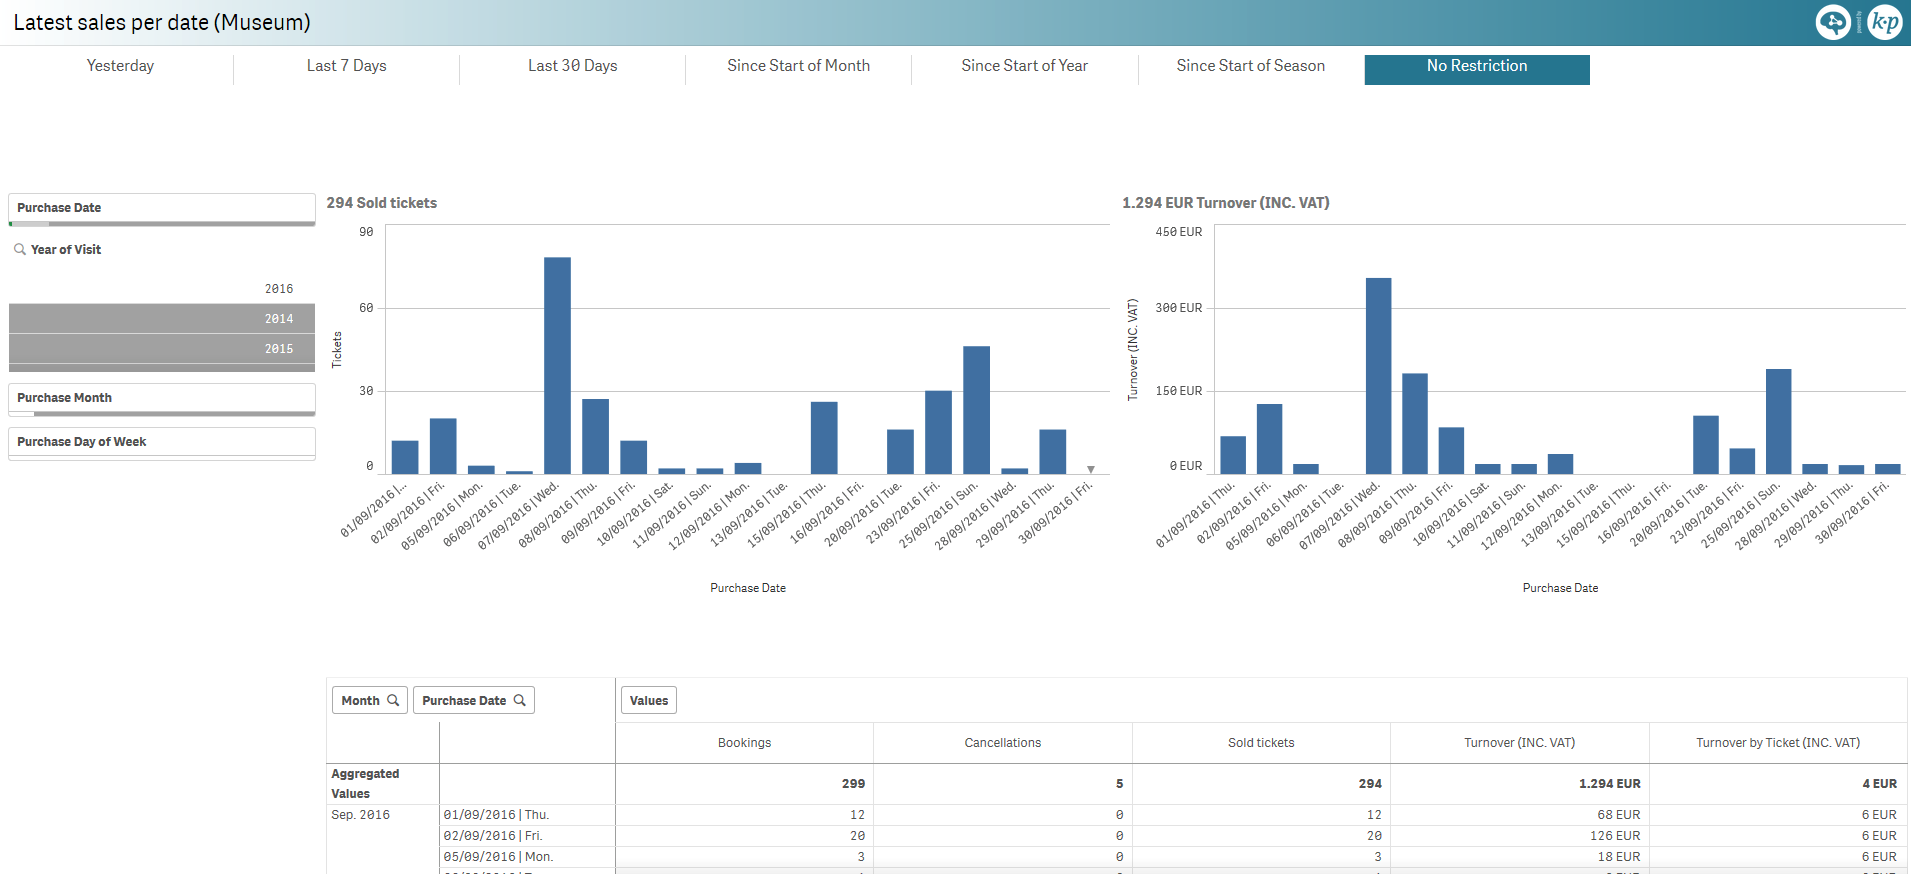
Latest sales per date [MU]
Latest ticket sales and revenue per sales date.
Pivot table by month and purchase date for the following measures:
- Number of sold tickets (including cancellations)
- Number of cancellations
- Number of sold tickets
- Revenue
- Revenue per ticket
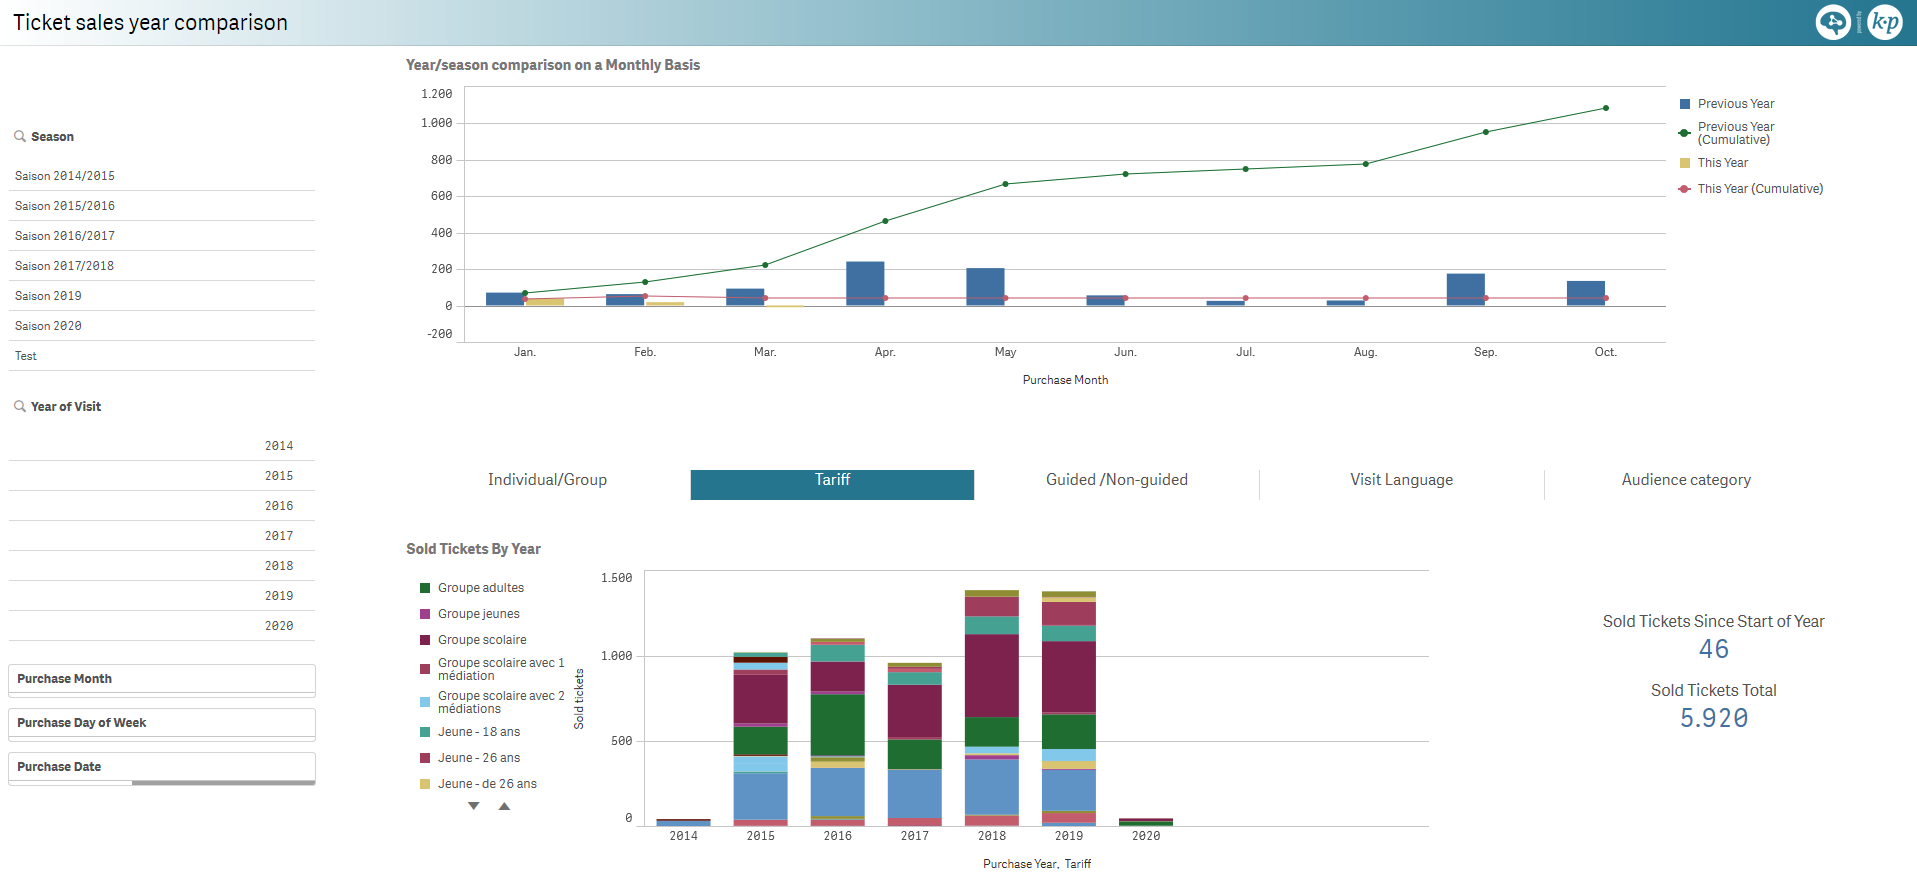
Ticket sales year comparison [MU]
Monthly sold tickets comparison over the last two seasons or years, including cumulative numbers.
Sold tickets distributed per year, split by:
- Individual/group
- Tariff
- Guided/non guided
- Visit language
- Audience category
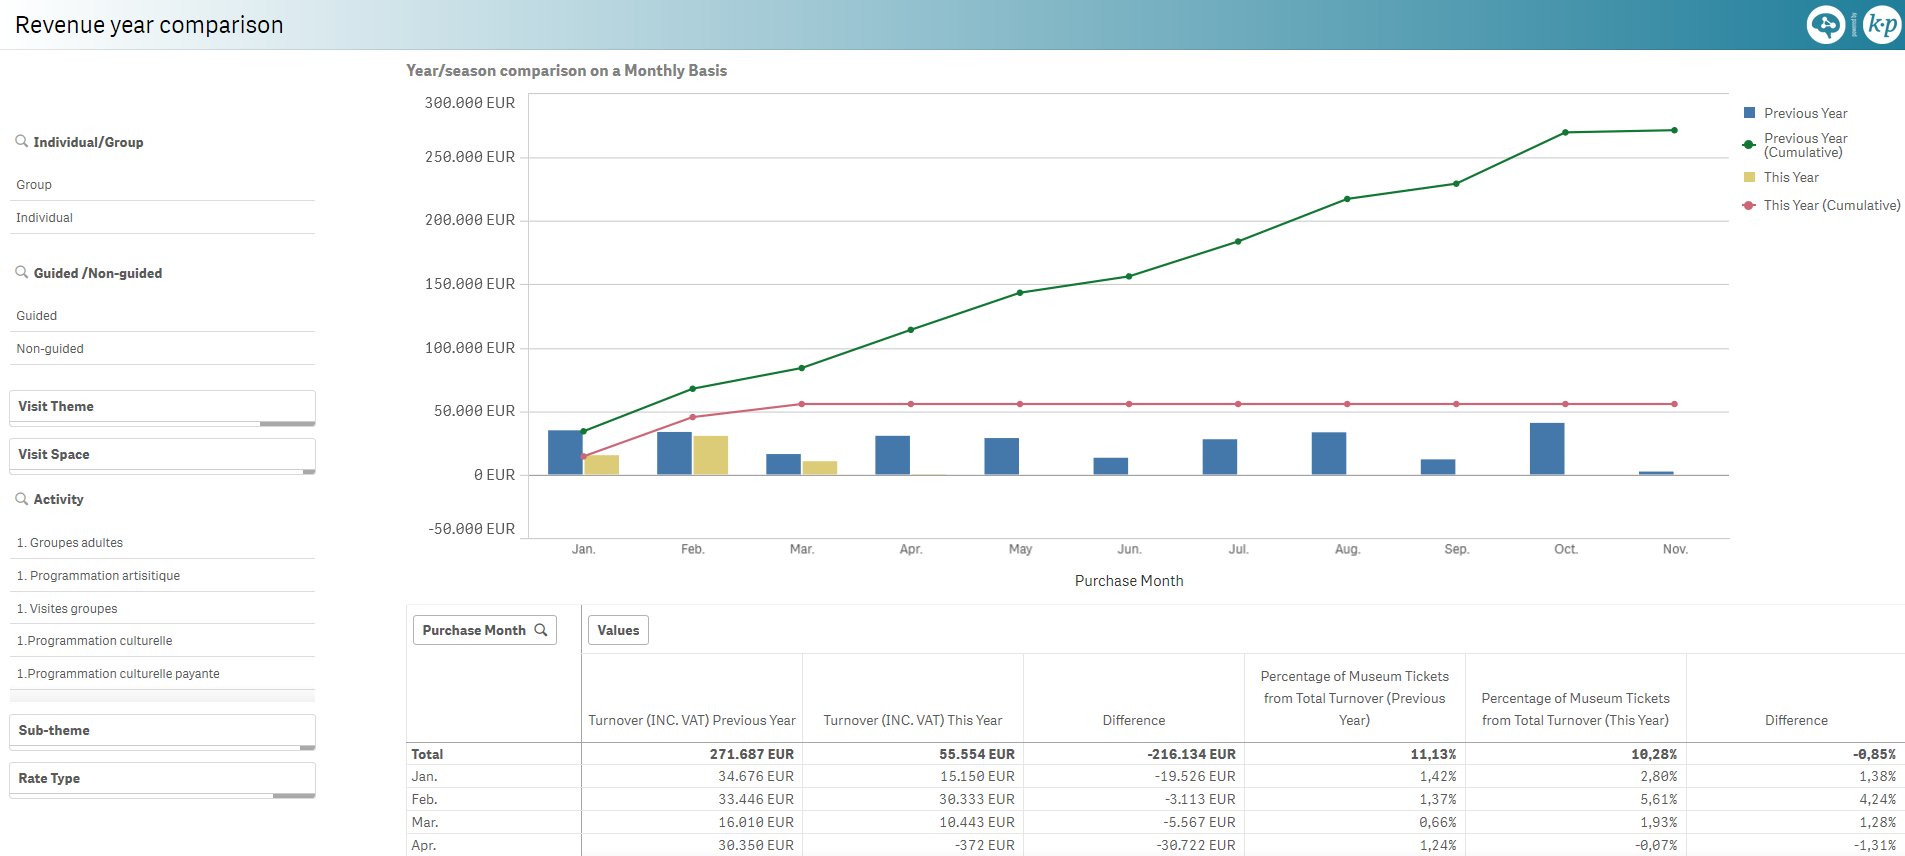
Revenue year comparison [MU]
Monthly revenue comparison over the last two seasons or years, including cumulative numbers.
Pivot table by month of purchase for the following measures:
- Revenue of the previous year
- Revenue of the current year
- Revenue difference
- Percentage of visits revenue over the total revenue for the previous year
- Percentage of visits revenue over the total revenue for the current year
- Percentage point difference
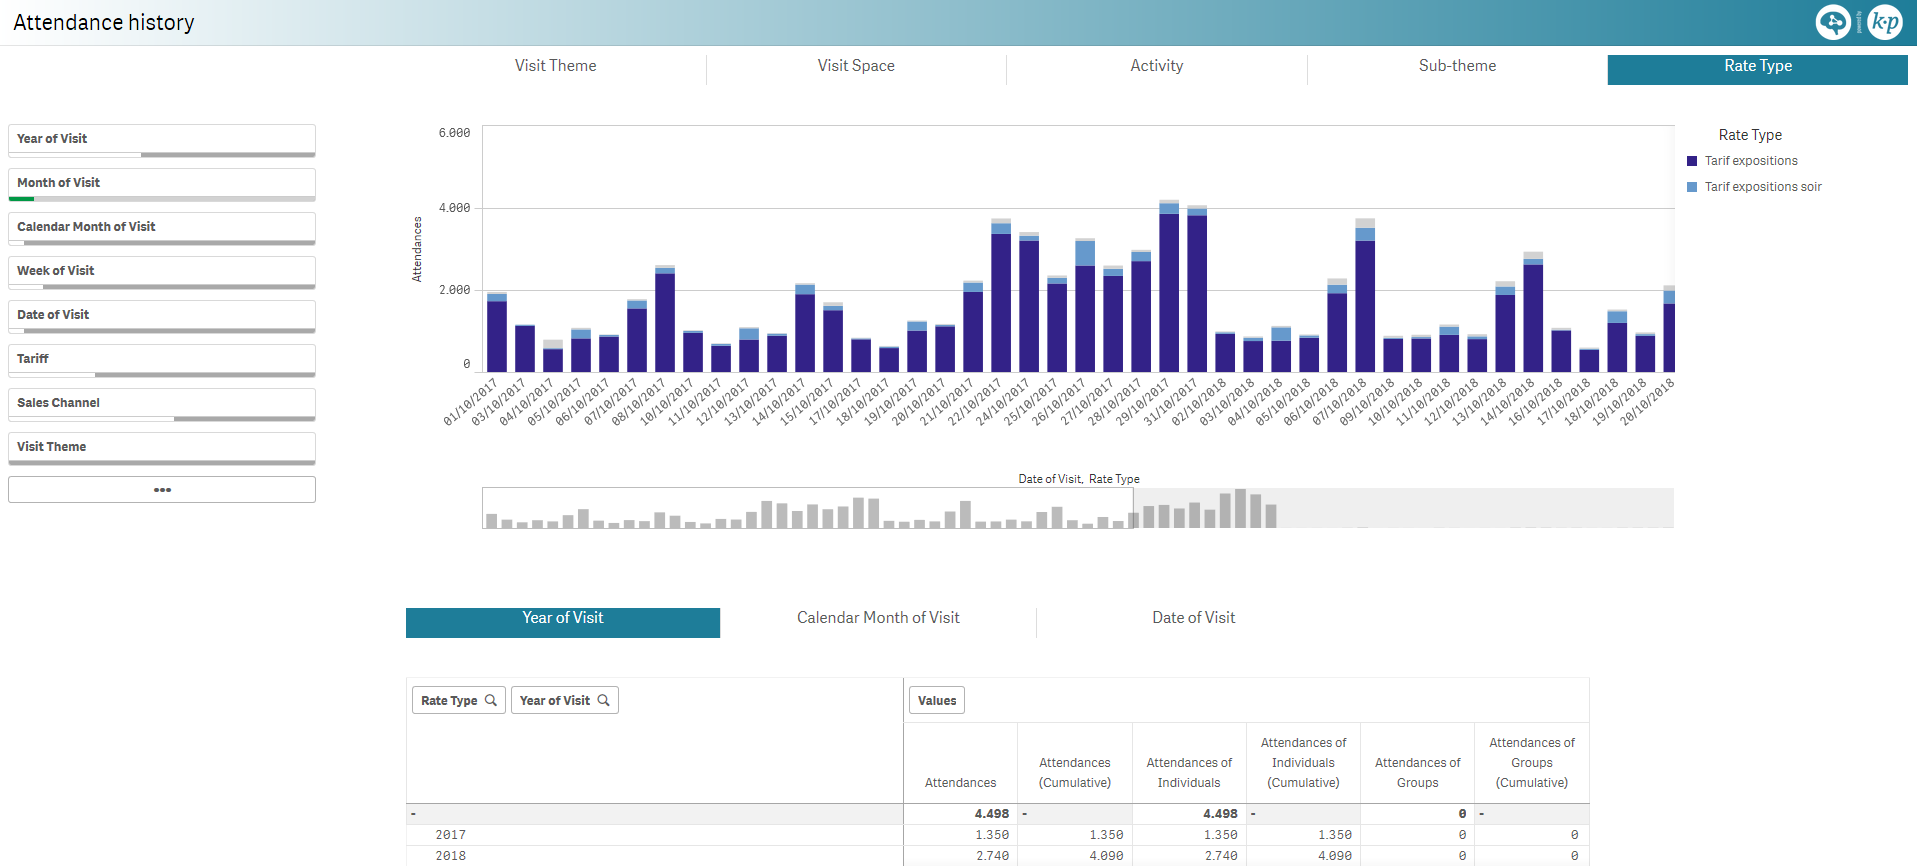
Attendance history [MU]
Daily attendance split by:
- Visit theme
- Visit space
- Activity
- Sub-theme
- Rate type
Pivot table for the selected dimension and by year of visit, month of visit and date of visit for the following measures:
- Attendance
- Cumulative attendance
- Individual attendance
- Cumulative individual attendance
- Group attendance
- Cumulative group attendance
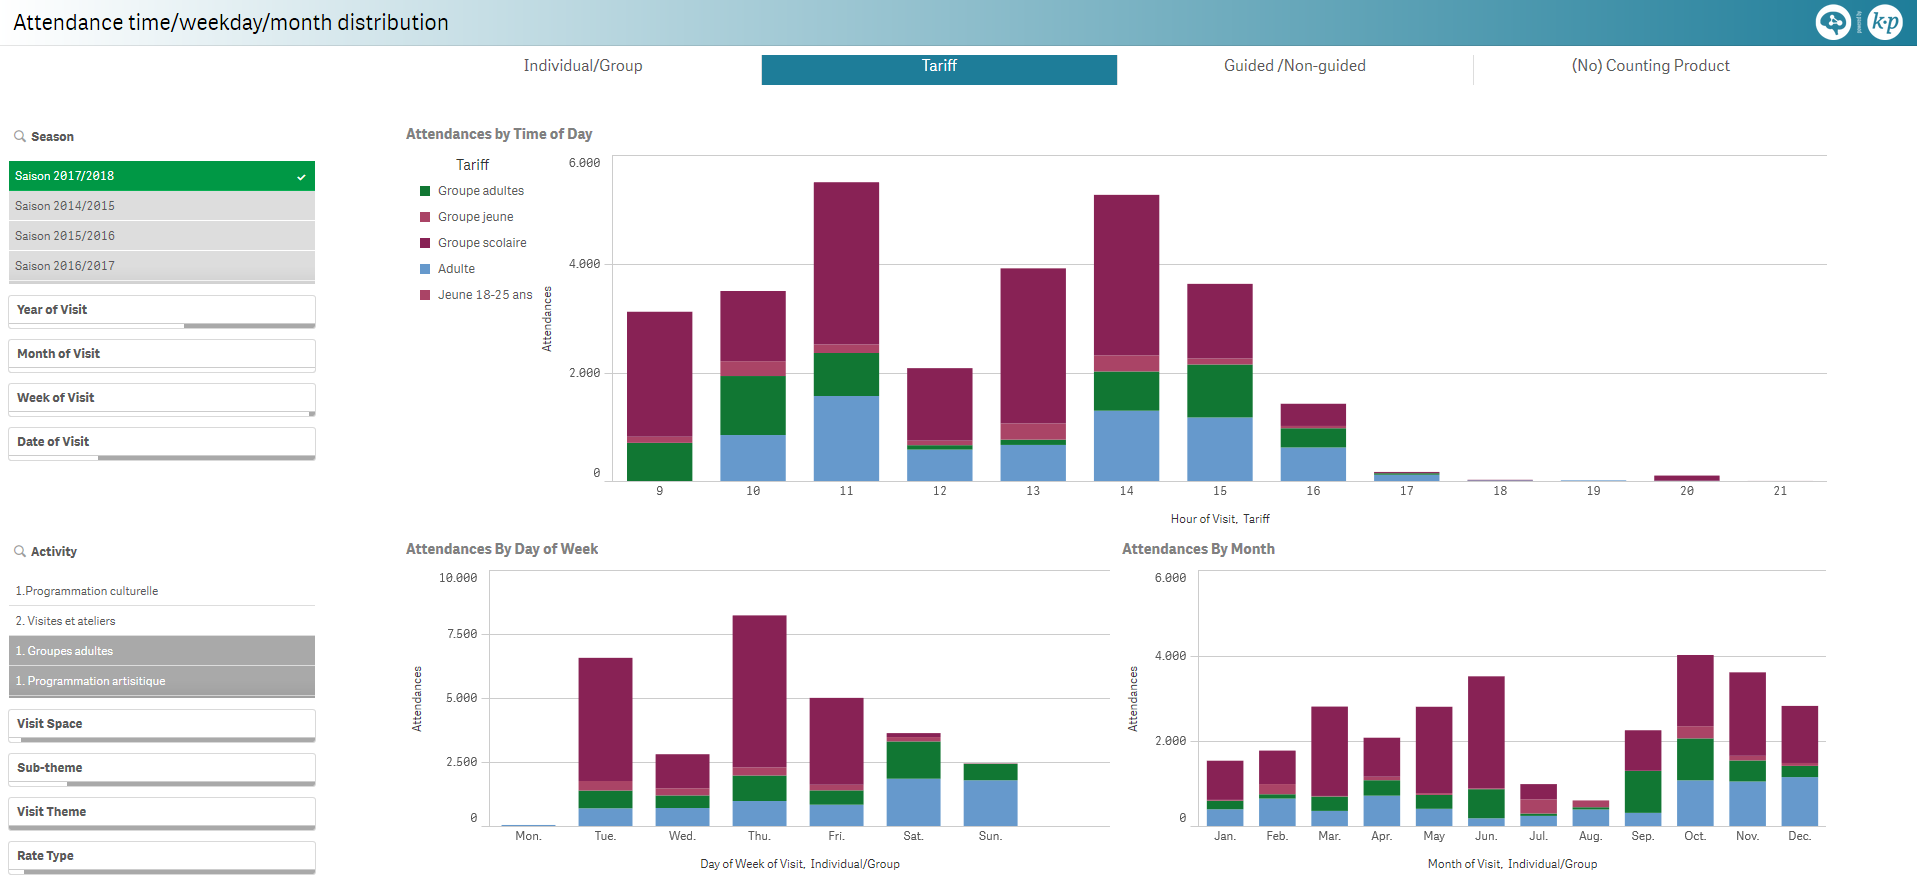
Attendance time/weekday/month distribution [MU]
Attendance distributed per time of the day, day of the week and month of the year, split by:
- Individual/group
- Tariff
- Guided/non guided
- Counting product (or not)
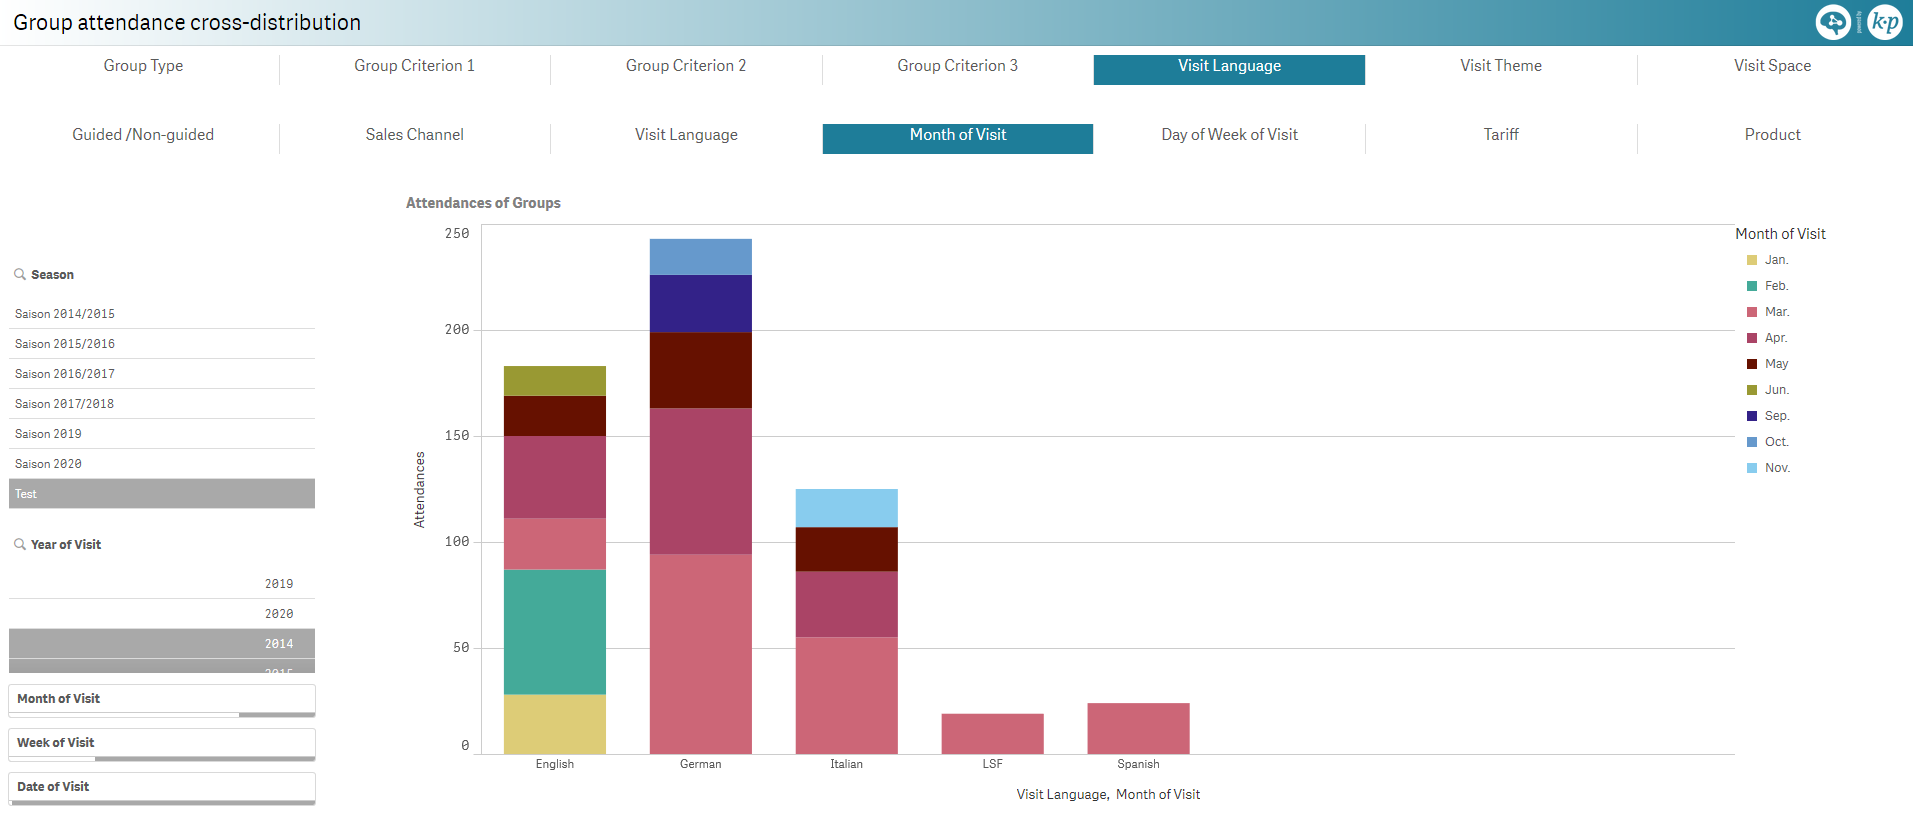
Group attendance cross-distribution [MU]
Group attendance:
| distributed per | and split by |
|---|---|
|
|
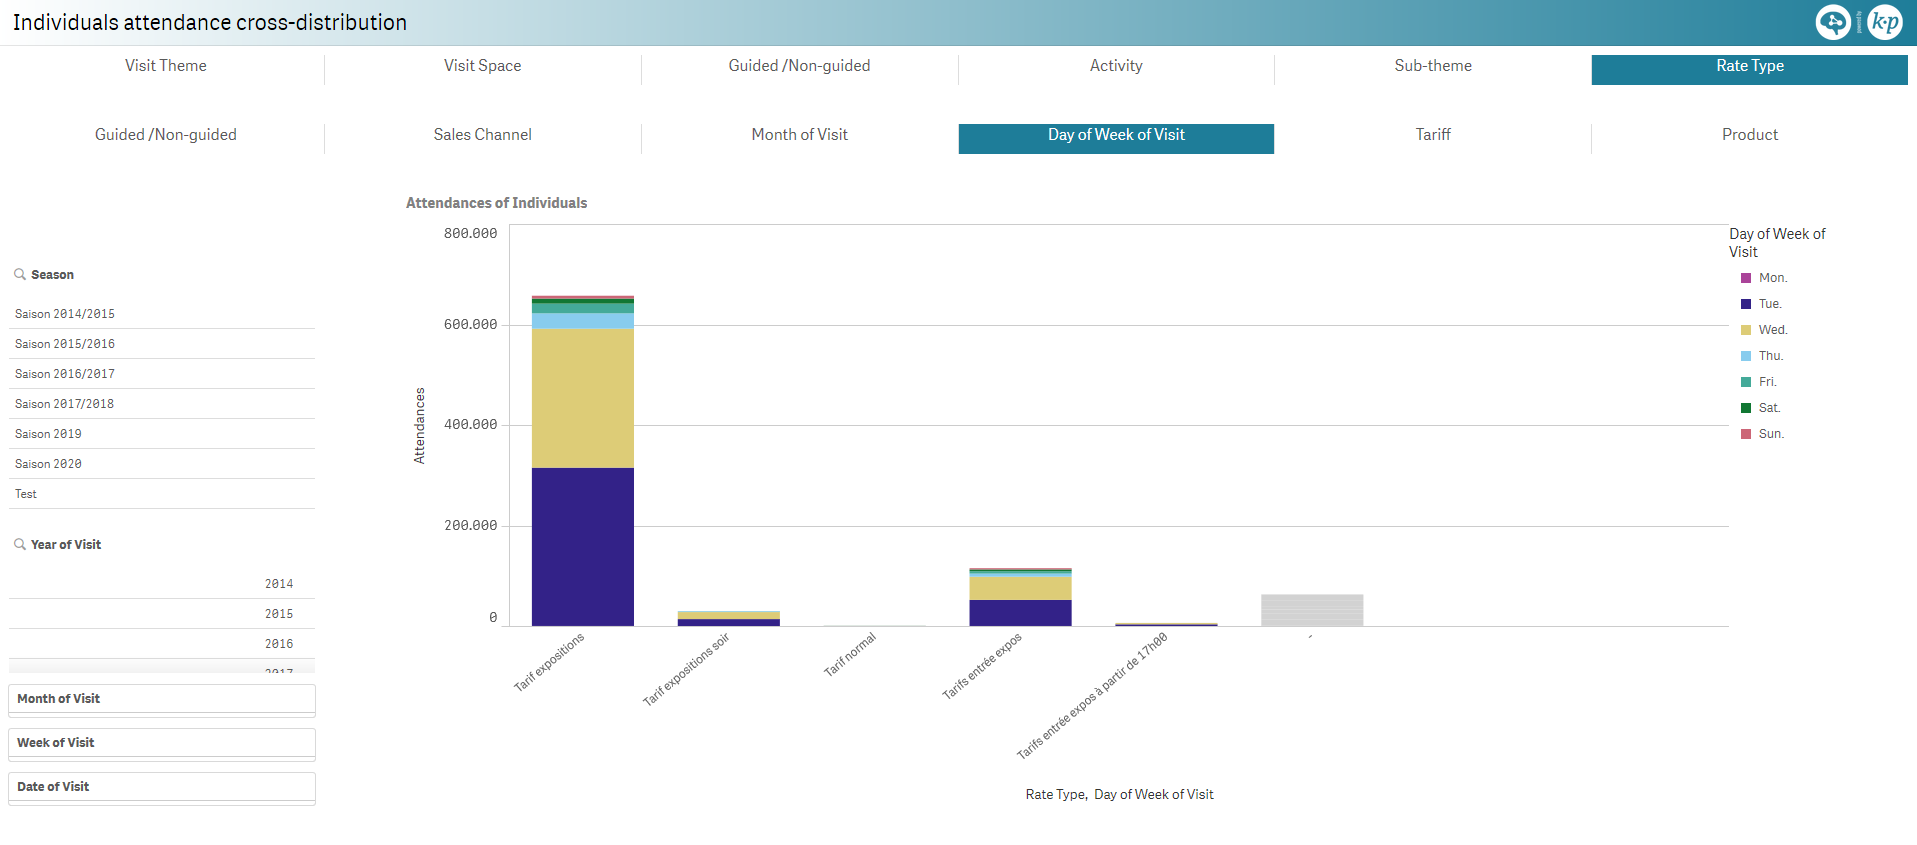
Individuals attendance cross-distribution [MU]
Individuals attendance:
| distributed per | and split by |
|---|---|
|
|
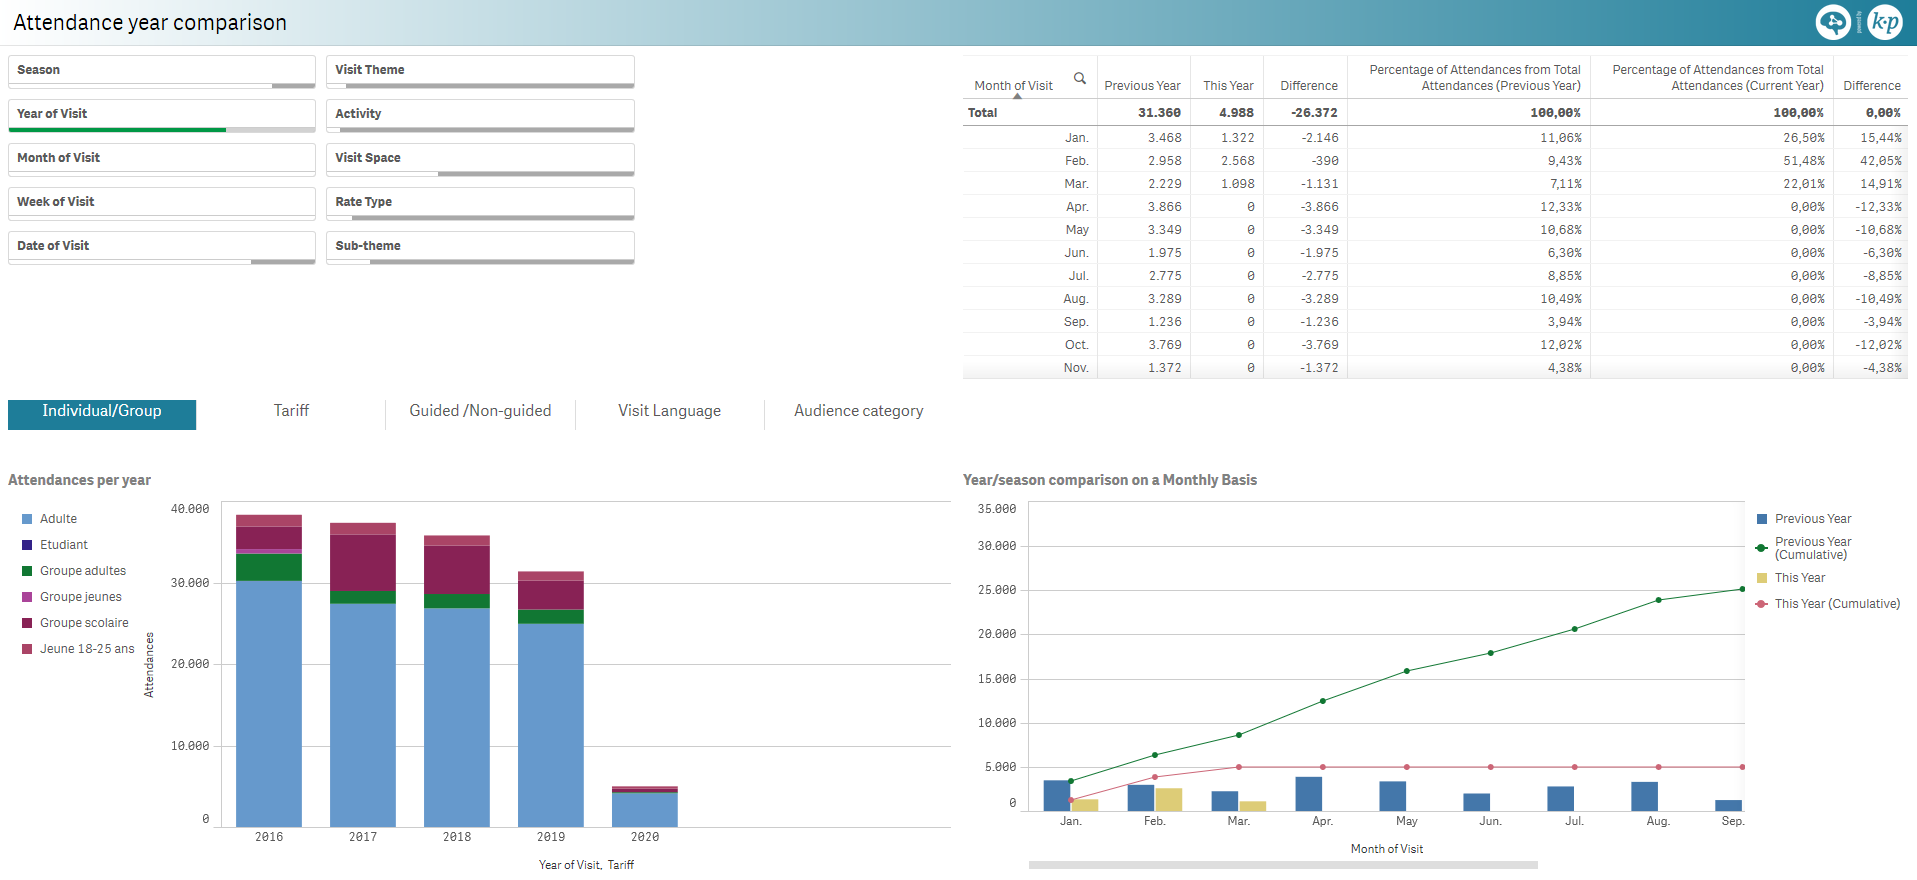
Attendance year comparison [MU]
Pivot table by month of visit for the following measures:
- Attendance of the previous year
- Attendance of the current year
- Difference in attendance between the current and previous year
- Percentage of attendance per month for the previous year
- Percentage of attendance per month for the current year
- Percentage point difference between monthly attendance percentages
Attendance distributed per year, split by:
- Individual/group
- Tariff
- Guided/non guided
- Visit language
- Audience category
Previous versus current year monthly attendance comparison.
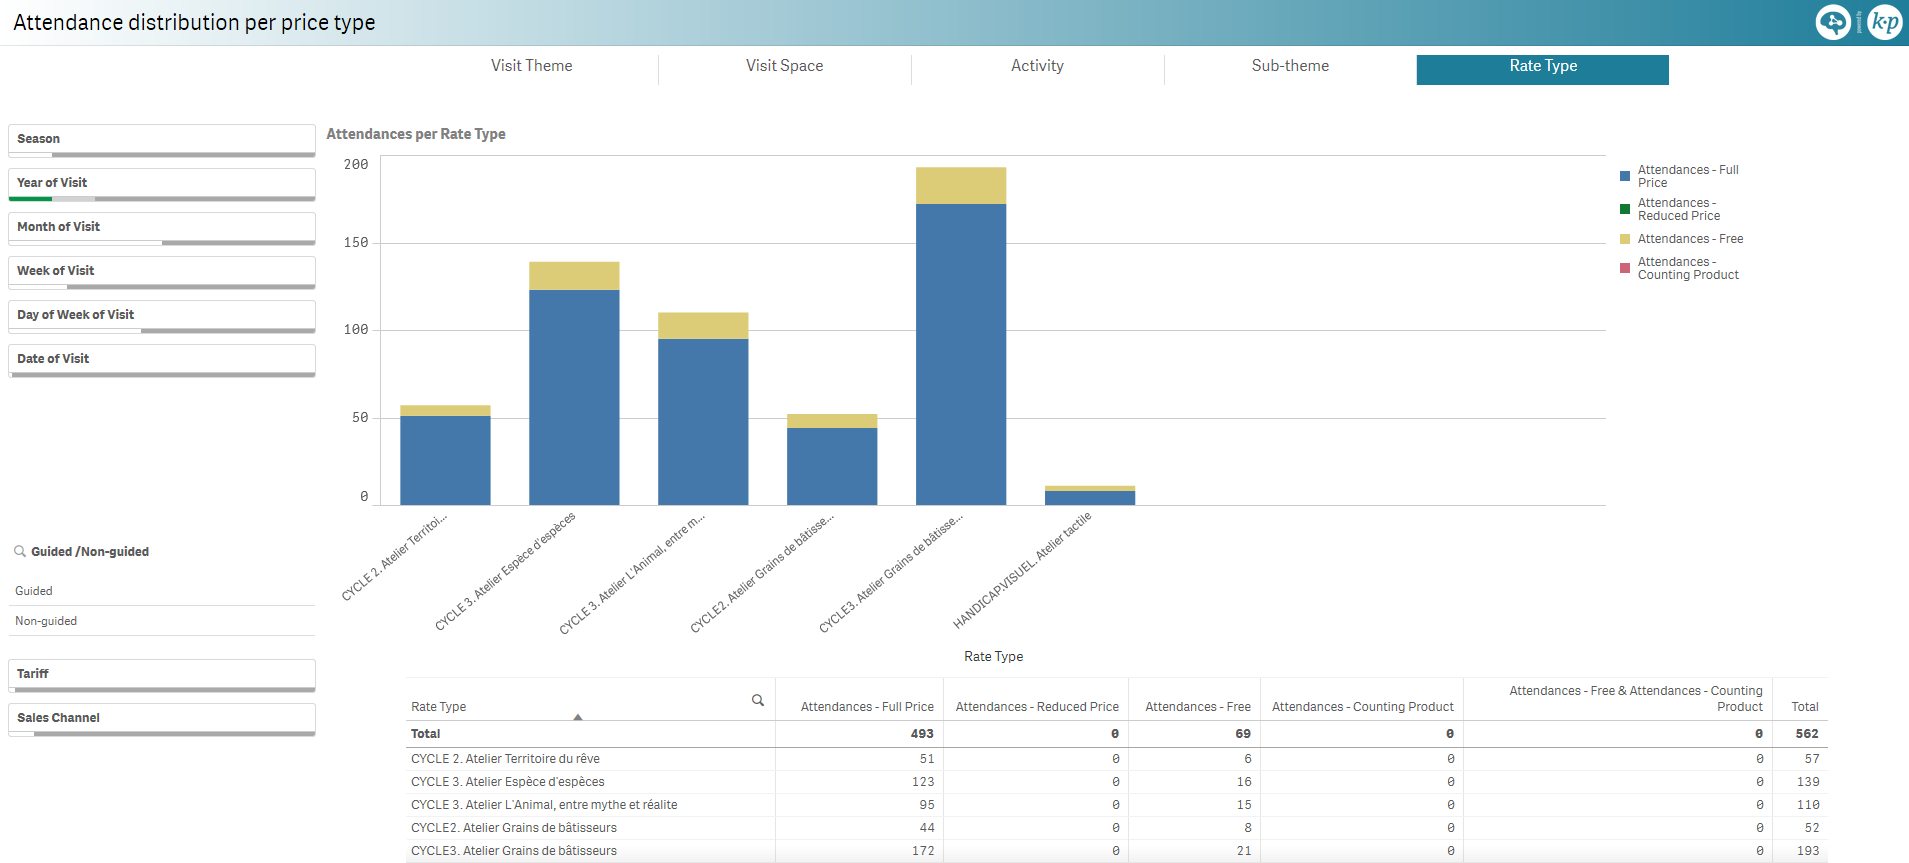
Attendance distribution per price type [MU]
Attendance distributed per price type, split by:
- Visit theme
- Visit space
- Activity
- Sub-theme
- Rate type
Attendance pivot table by rate type, split by price type.
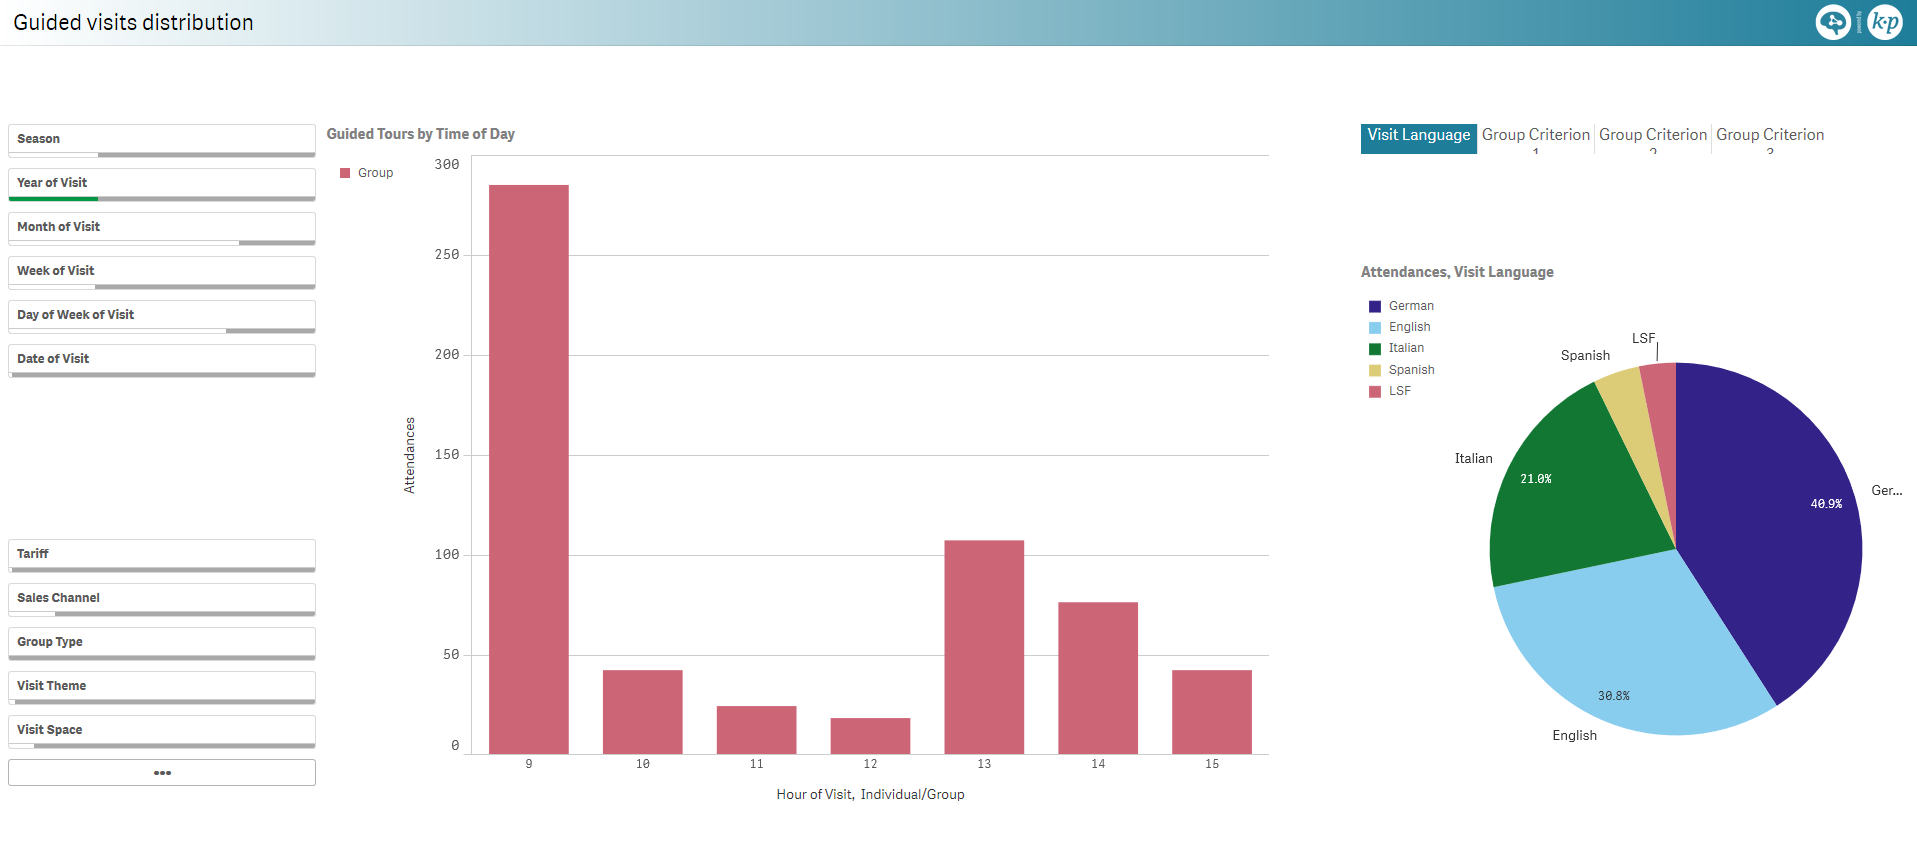
Guided visits distribution [MU]
Attendance distributed per hour of the day, split by individual/group.
Relative attendance distributed per:
- Visit language
- Group criterion 1
- Group criterion 2
- Group criterion 3
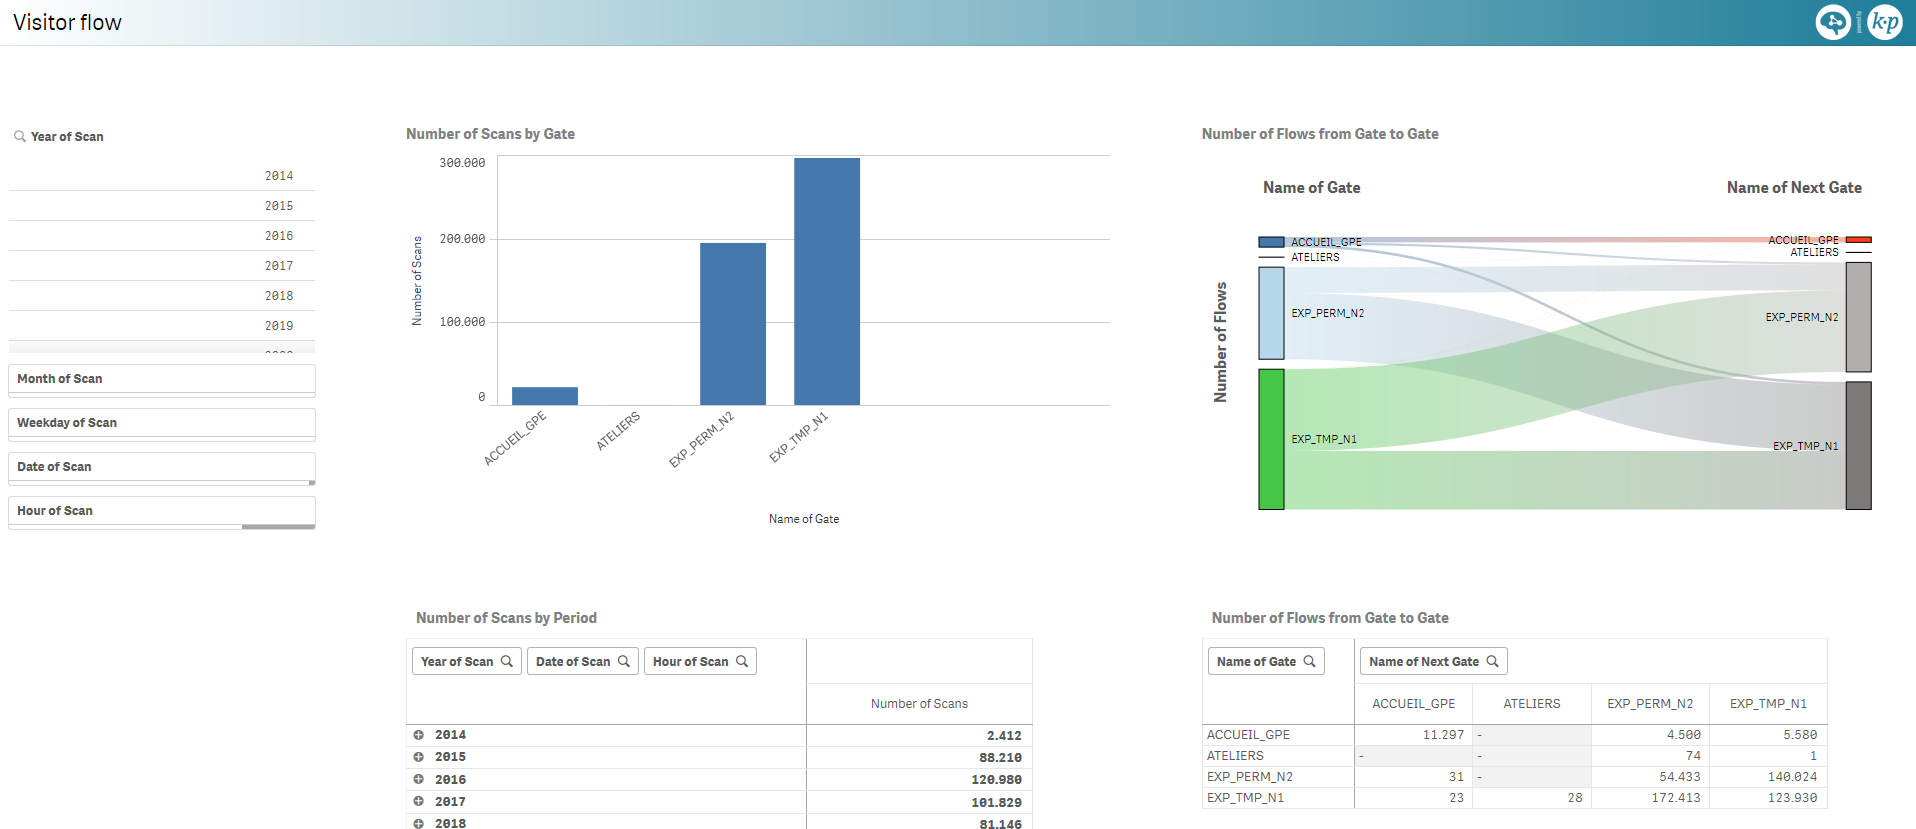
Visitor flow [MU]
Ticket scans distributed by gate.
Ticket scans pivot table by year of scan, date of scan and hour of scan.
Gate to gate ticket scan flow chart.
Ticket scans gate to gate pivot table.
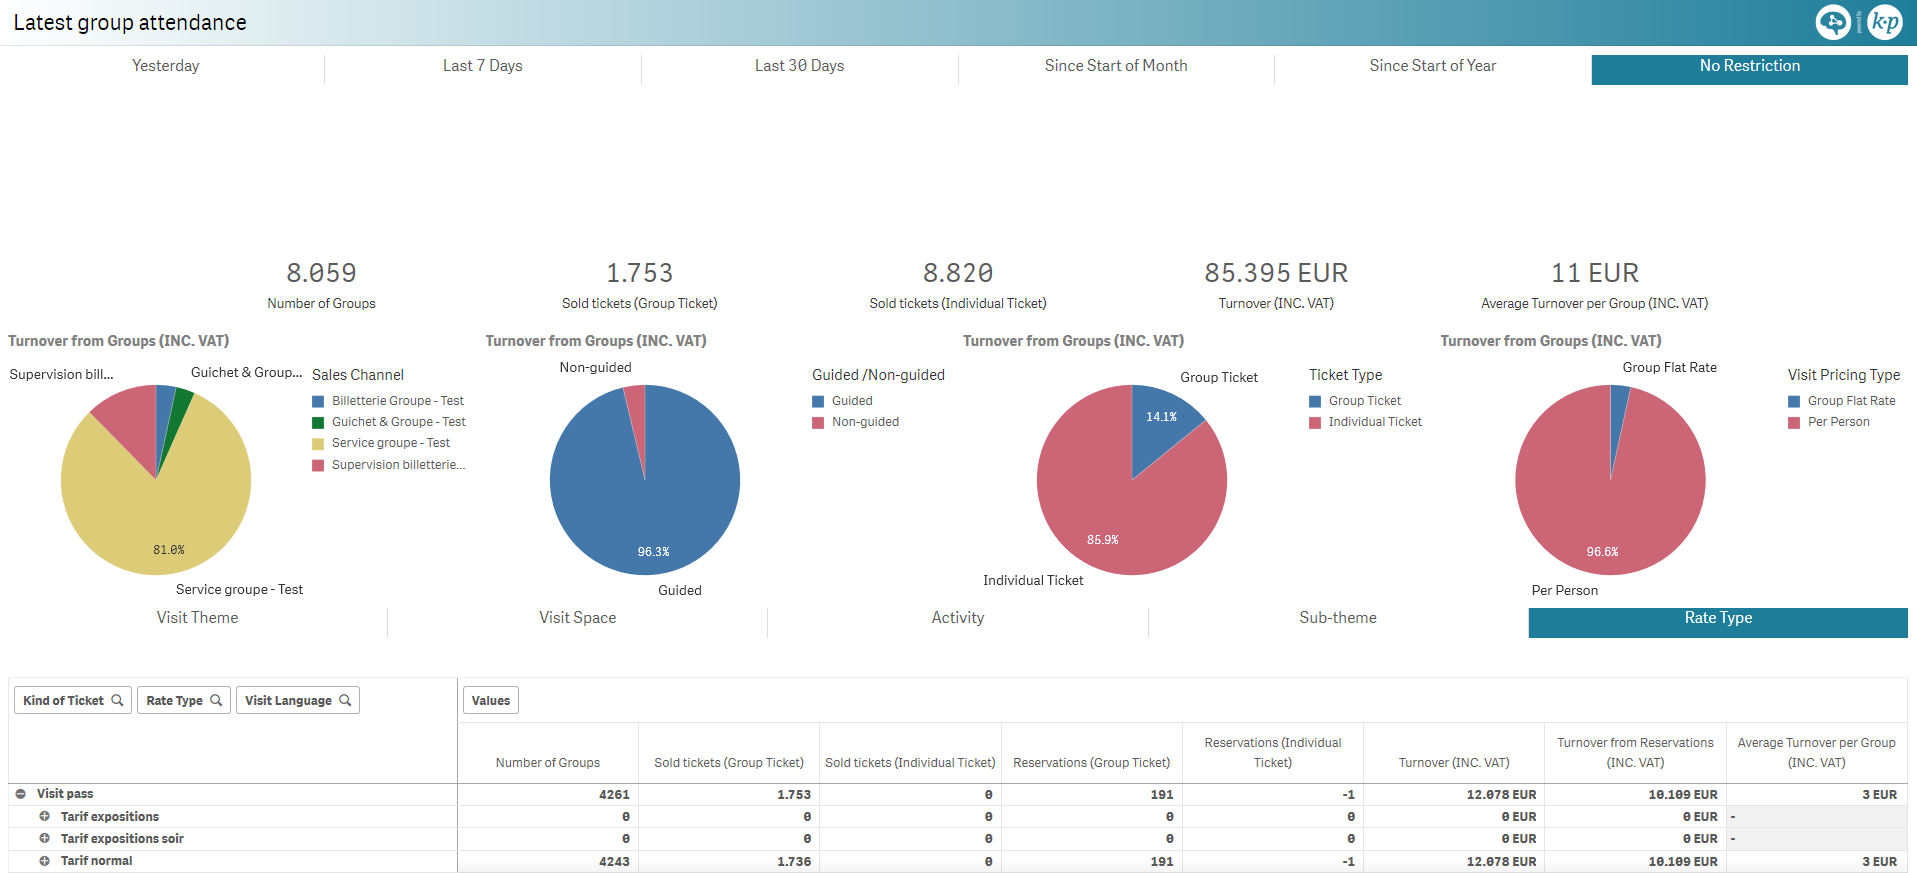
Latest group attendance [MU]
KPI for the latest group visit ticket sales and revenue:
- Number of groups
- Number of group tickets sold
- Number of individual tickets sold
- Revenue
- Revenue per group
Relative revenue from groups distributed per:
- Sales channel
- Guided/non guided
- Ticket type
- Visit price type (flat rate, individual rate)
Pivot table by ticket kind (product family), visit theme/visit space/activity/sub-theme/rate type and visit language, for the following measures:
- Number of groups
- Number of group tickets sold
- Number of individual tickets sold
- Number of group ticket reservations
- Number of individual ticket reservations
- Revenue
- Potential revenue from reservations
- Revenue per group
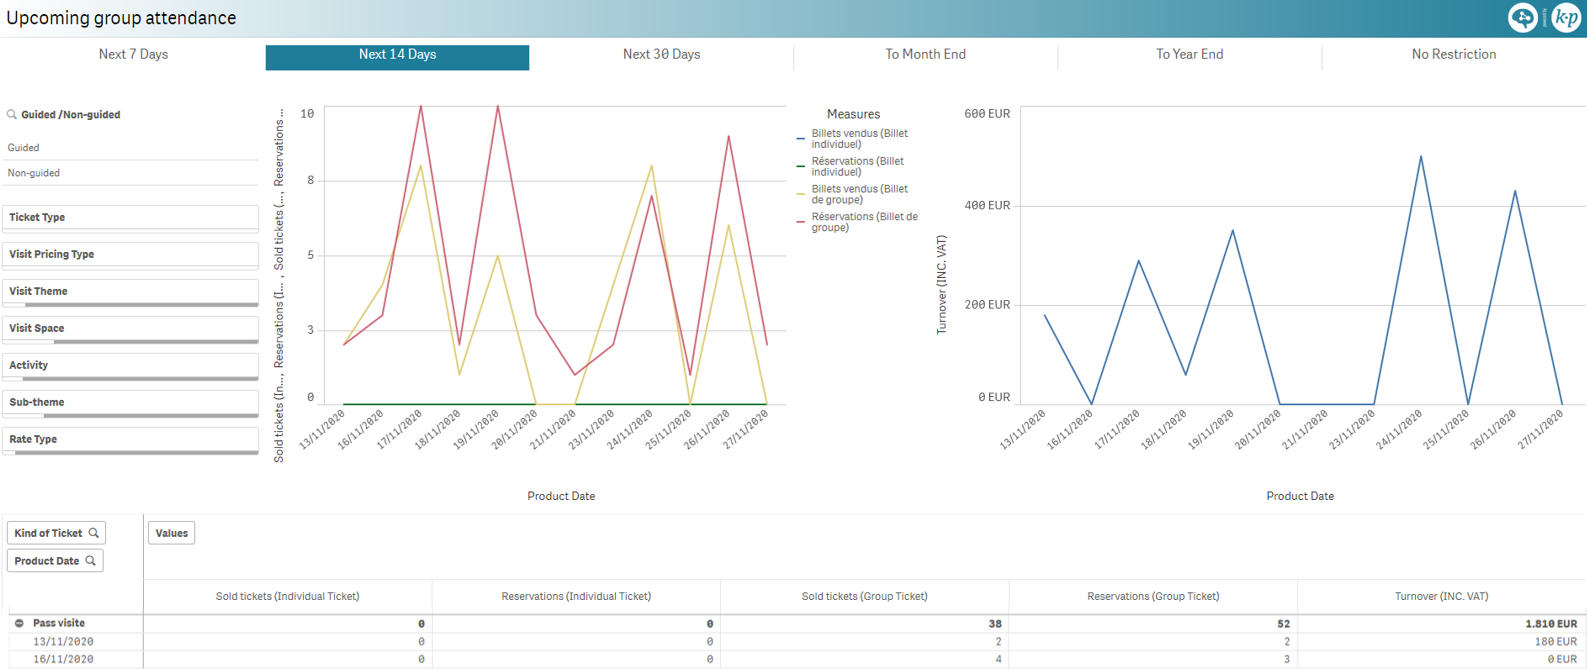
Upcoming group attendance [MU]
Upcoming group visit ticket sales, split by the following measures, and revenue distributed per visit date:
- Number of group tickets sold
- Number of individual tickets sold
- Number of group ticket reservations
- Number of individual ticket reservations
Pivot table by ticket kind (product family) and visit date for the following measures:
- Number of group tickets sold
- Number of individual tickets sold
- Number of group ticket reservations
- Number of individual ticket reservations
- Revenue
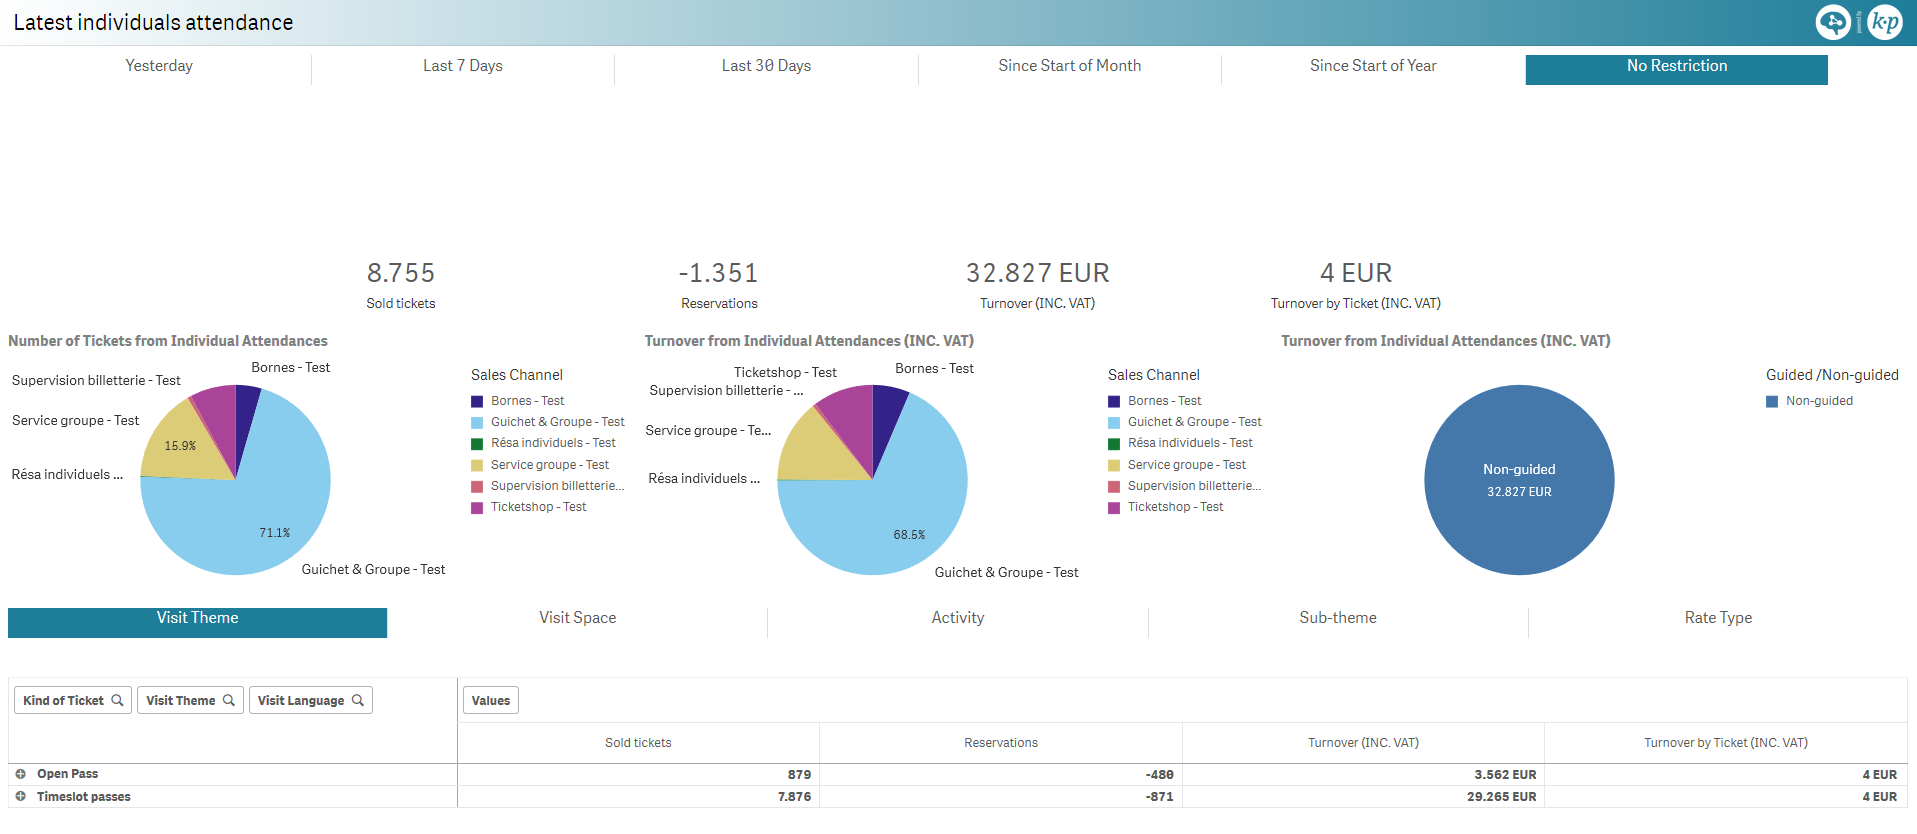
Latest individual attendance [MU]
KPI for the latest individual visit ticket sales and revenue:
- Number of sold tickets
- Number of reservations
- Revenue
- Revenue per ticket
Relative revenue from groups distributed per:
- Sales channel
- Guided/non guided
- Ticket type
- Visit price type (flat rate, individual rate)
Pivot table by ticket kind (product family), visit theme/visit space/activity/sub-theme/rate type and visit language, for the following measures:
- Number of groups
- Number of group tickets sold
- Number of individual tickets sold
- Number of group ticket reservations
- Number of individual ticket reservations
- Revenue
- Potential revenue from reservations
- Revenue per group
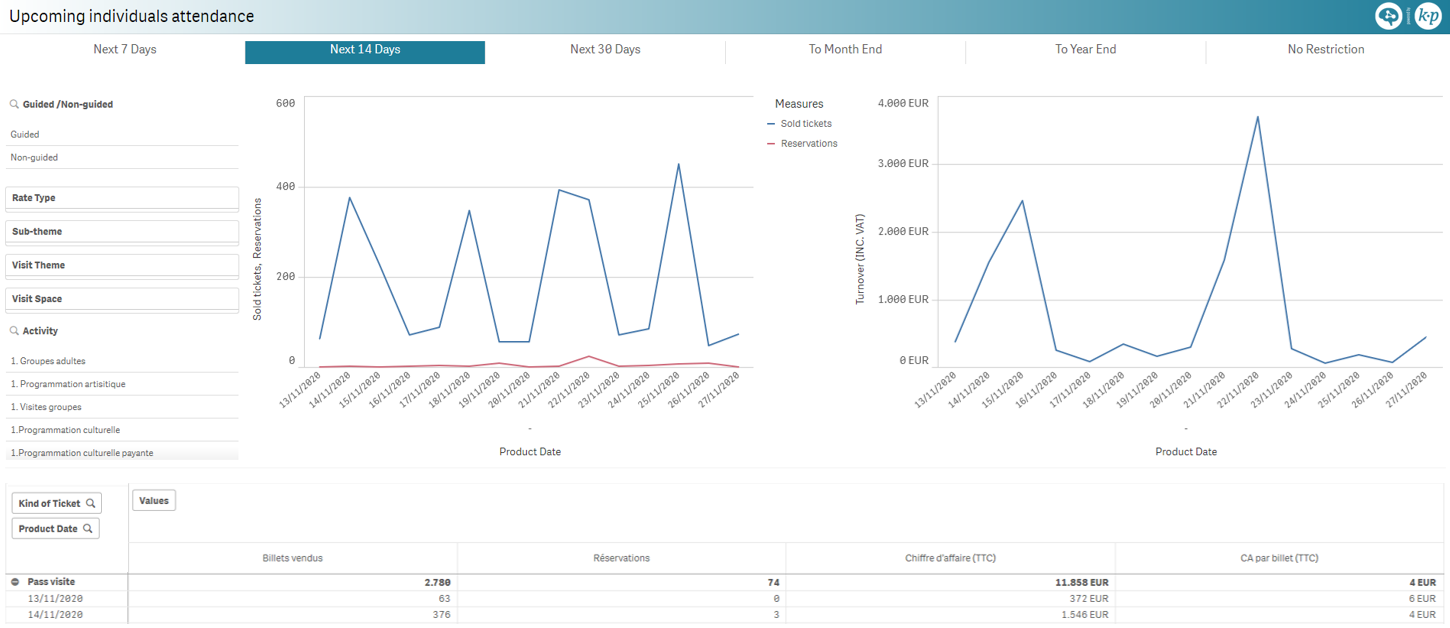
Upcoming individuals attendance [MU]
Upcoming group visit ticket sales, split by the following measures, and revenue distributed per visit date:
- Number of sold tickets
- Number of reservations
Pivot table by ticket kind (product family) and visit date for the following measures:
- Number of sold tickets
- Number of reservations
- Revenue
- Revenue per ticket
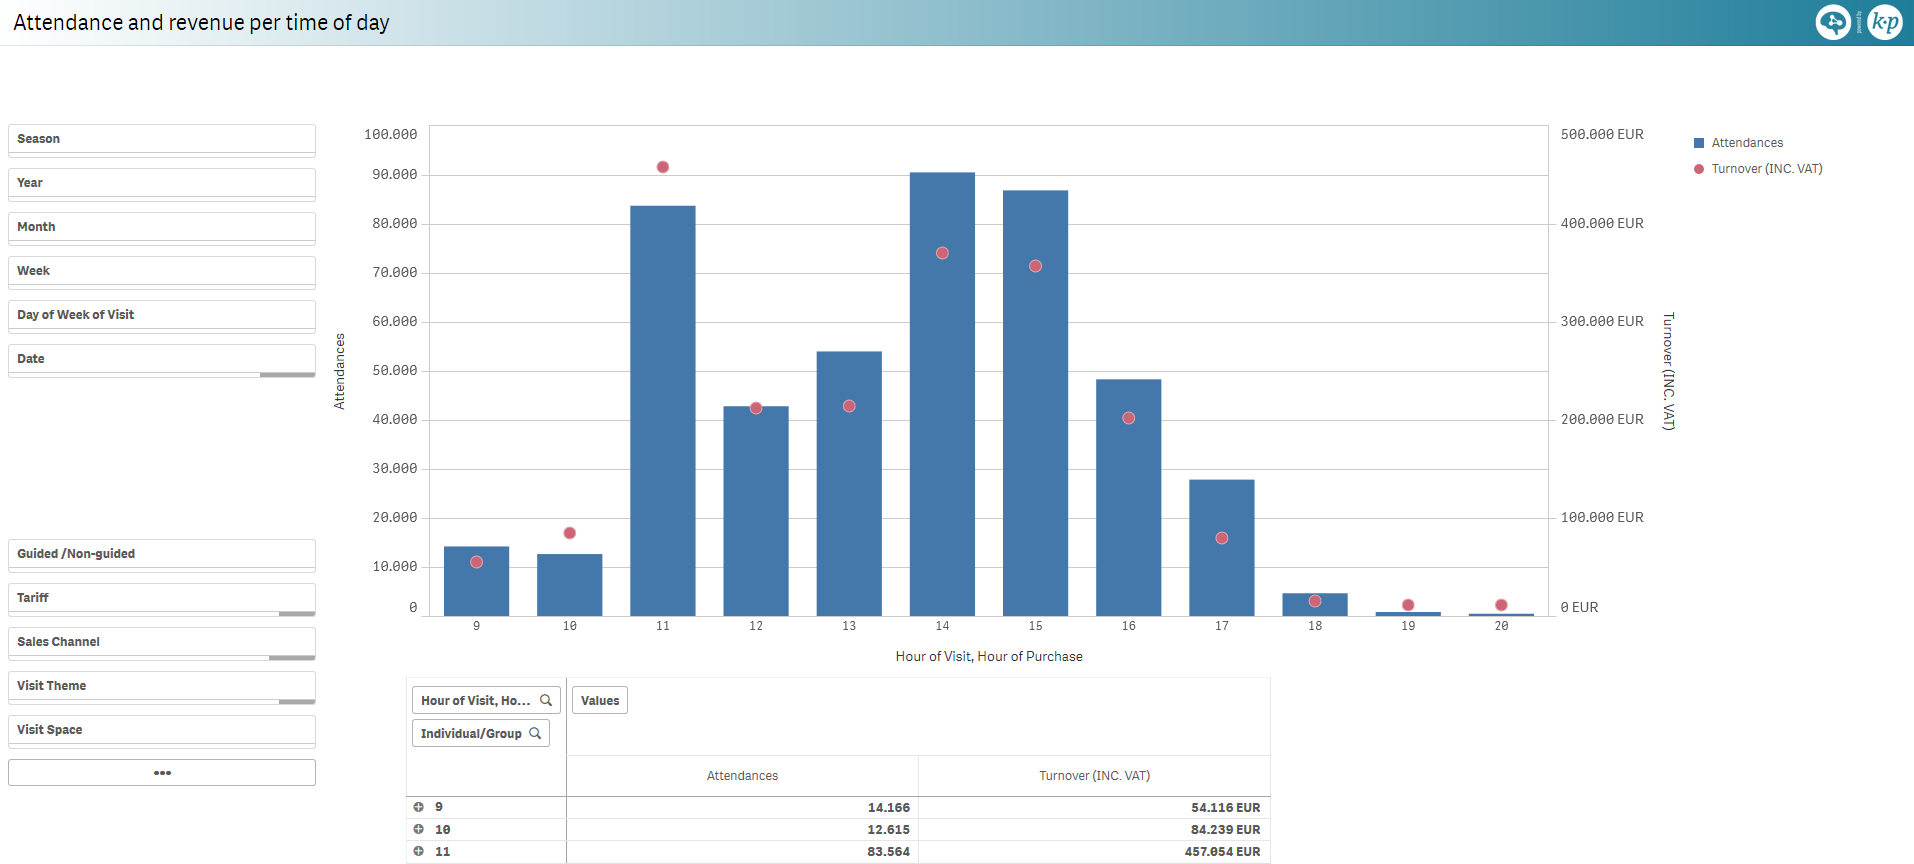
Attendance and revenue per time of day [MU]
Attendance and revenue distributed per time of the day.
Pivot table by hour of visit for the attendance and hour of purchase for the revenue.
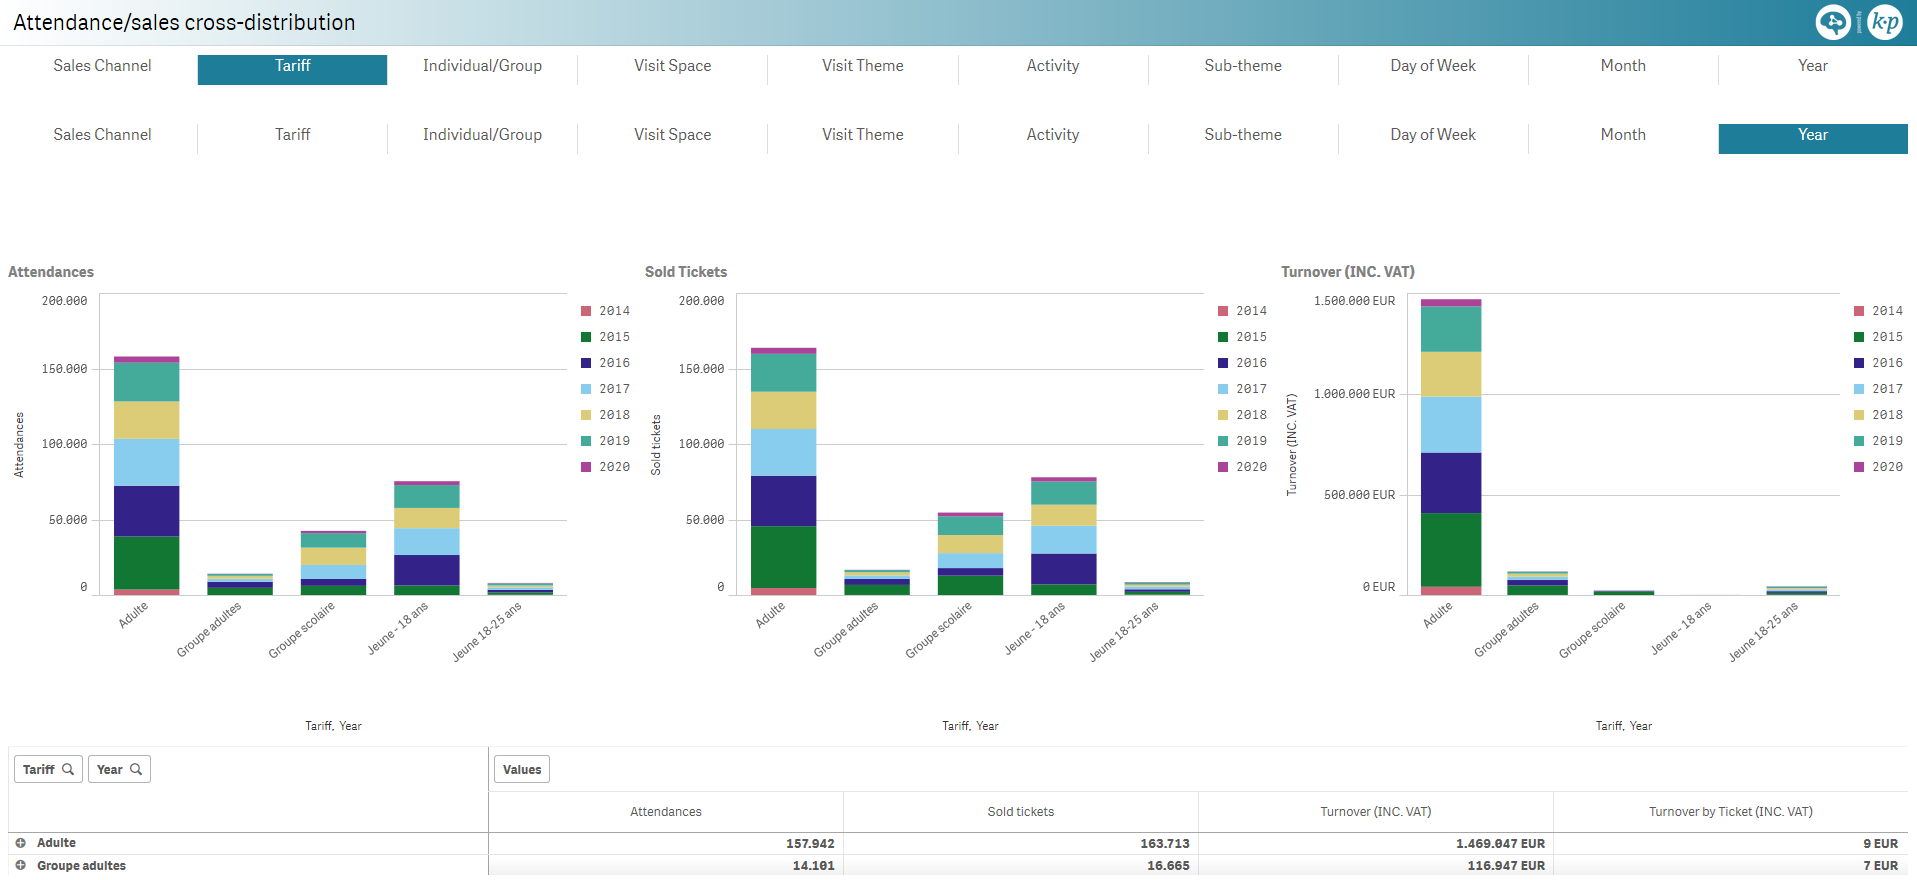
Attendance/sales cross-distribution [MU]
Attendance, sold tickets and revenue both distributed and split by:
- Sales channel
- Tariff
- Individual/group
- Visit space
- Visit theme
- Activity
- Sub-theme
- Day of week of visit
- Month of visit
- Year of visit
Pivot table for the selected dimensions and the following measures:
- Attendance
- Number of sold tickets
- Revenue
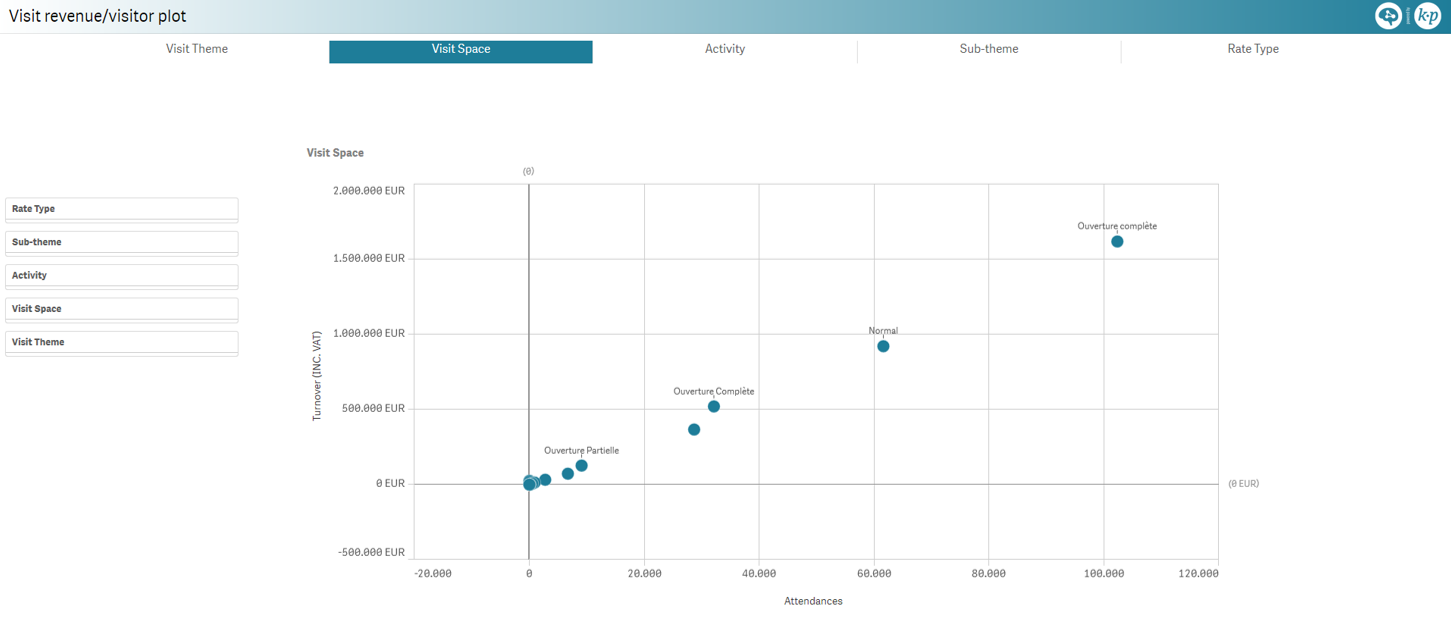
Visit revenue/visitor scatter plot [MU]
Scatter plot of attendance and revenue for each:
- Visit theme
- Visit space
- Activity
- Sub-theme
- Rate type
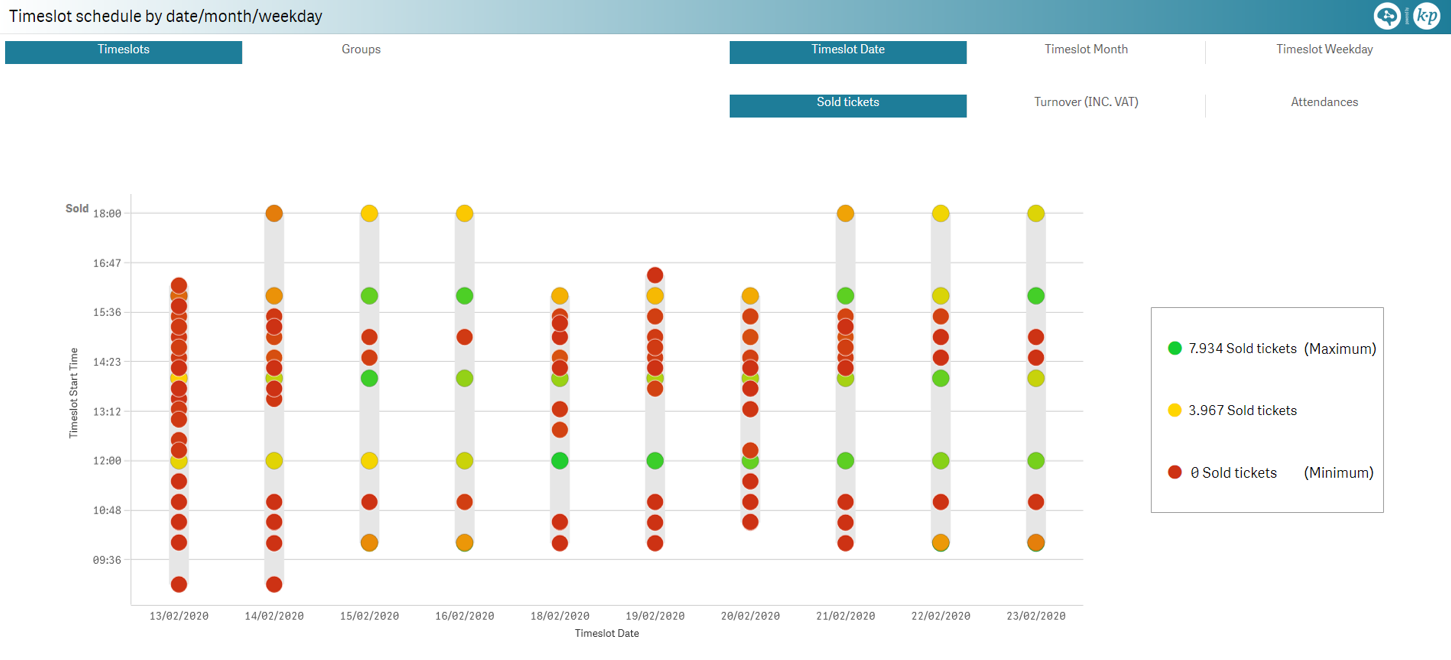
Timeslot schedule by date/month/weekday [MU]
Timeslots and groups start-time calendar view per date of visit, month of visit and day of the week of visit, color coded by:
- Number of sold tickets
- Revenue
- Attendance
- Group delay (for groups only)
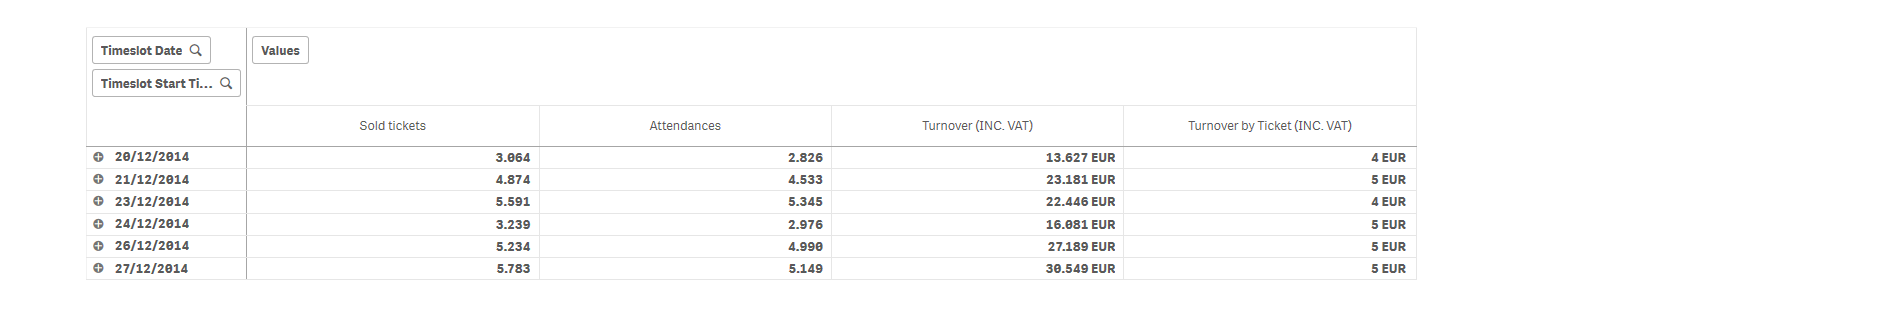
Pivot table for timeslot month, timeslot date and timeslot start time for the following measures:
- Number of sold tickets
- Attendance
- Revenue
- Revenue per ticket
Pivot table for group date, group arrival time for the following measures:
- Number of sold tickets
- Attendance
- Revenue
- Revenue per ticket
- Number of groups
- Group delay
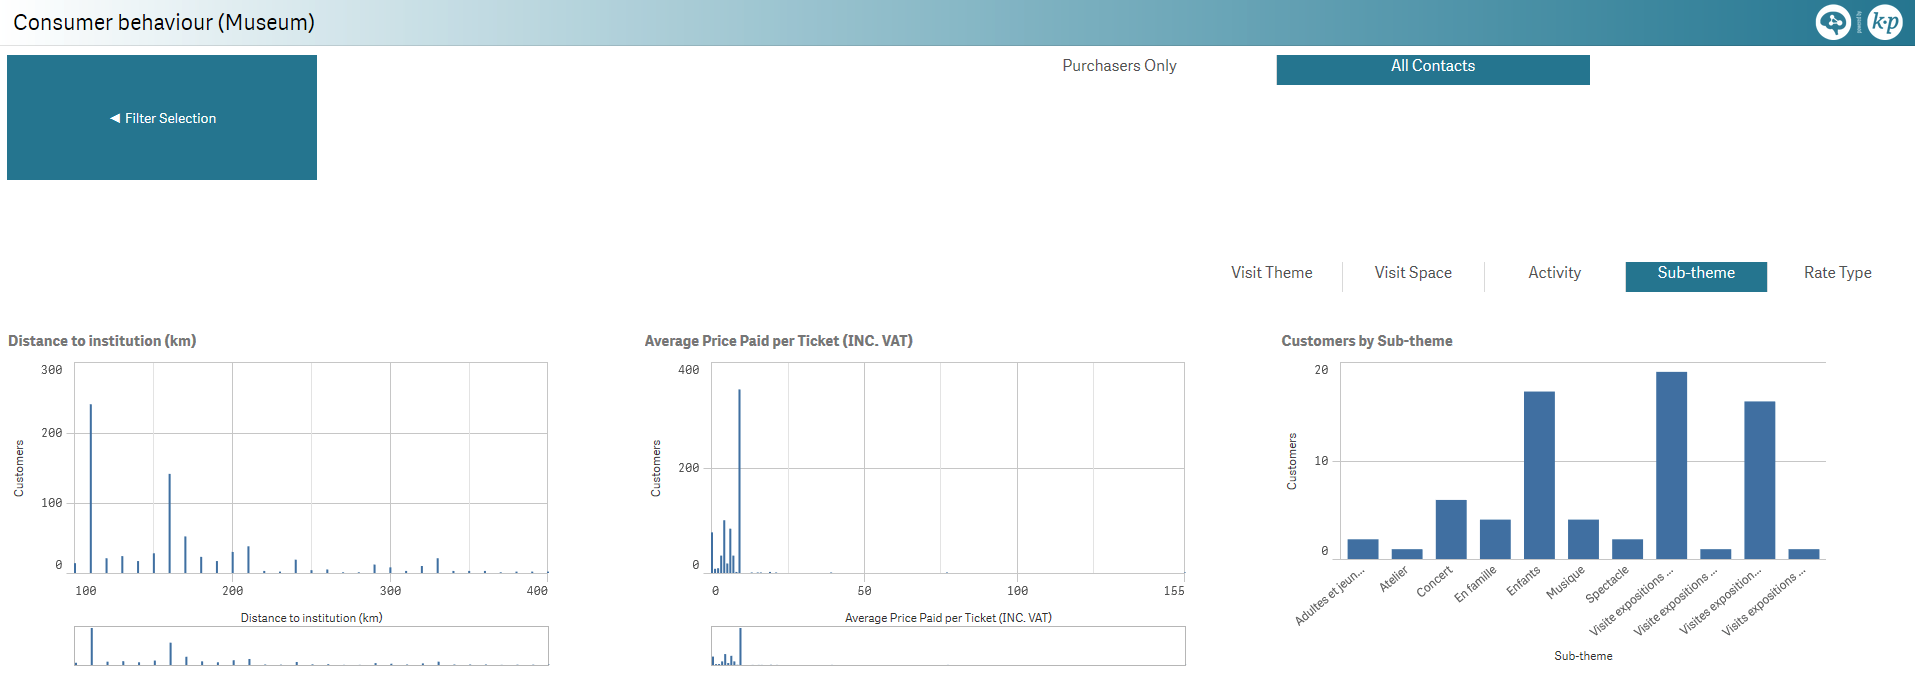
Consumer behaviour [MU]
Customers and total contacts, which also includes contacts with cancellations, distributed per:
- Distance to institution
- Average price per ticket
- Visit theme
- Visit space
- Activity
- Sub-theme
- Rate type
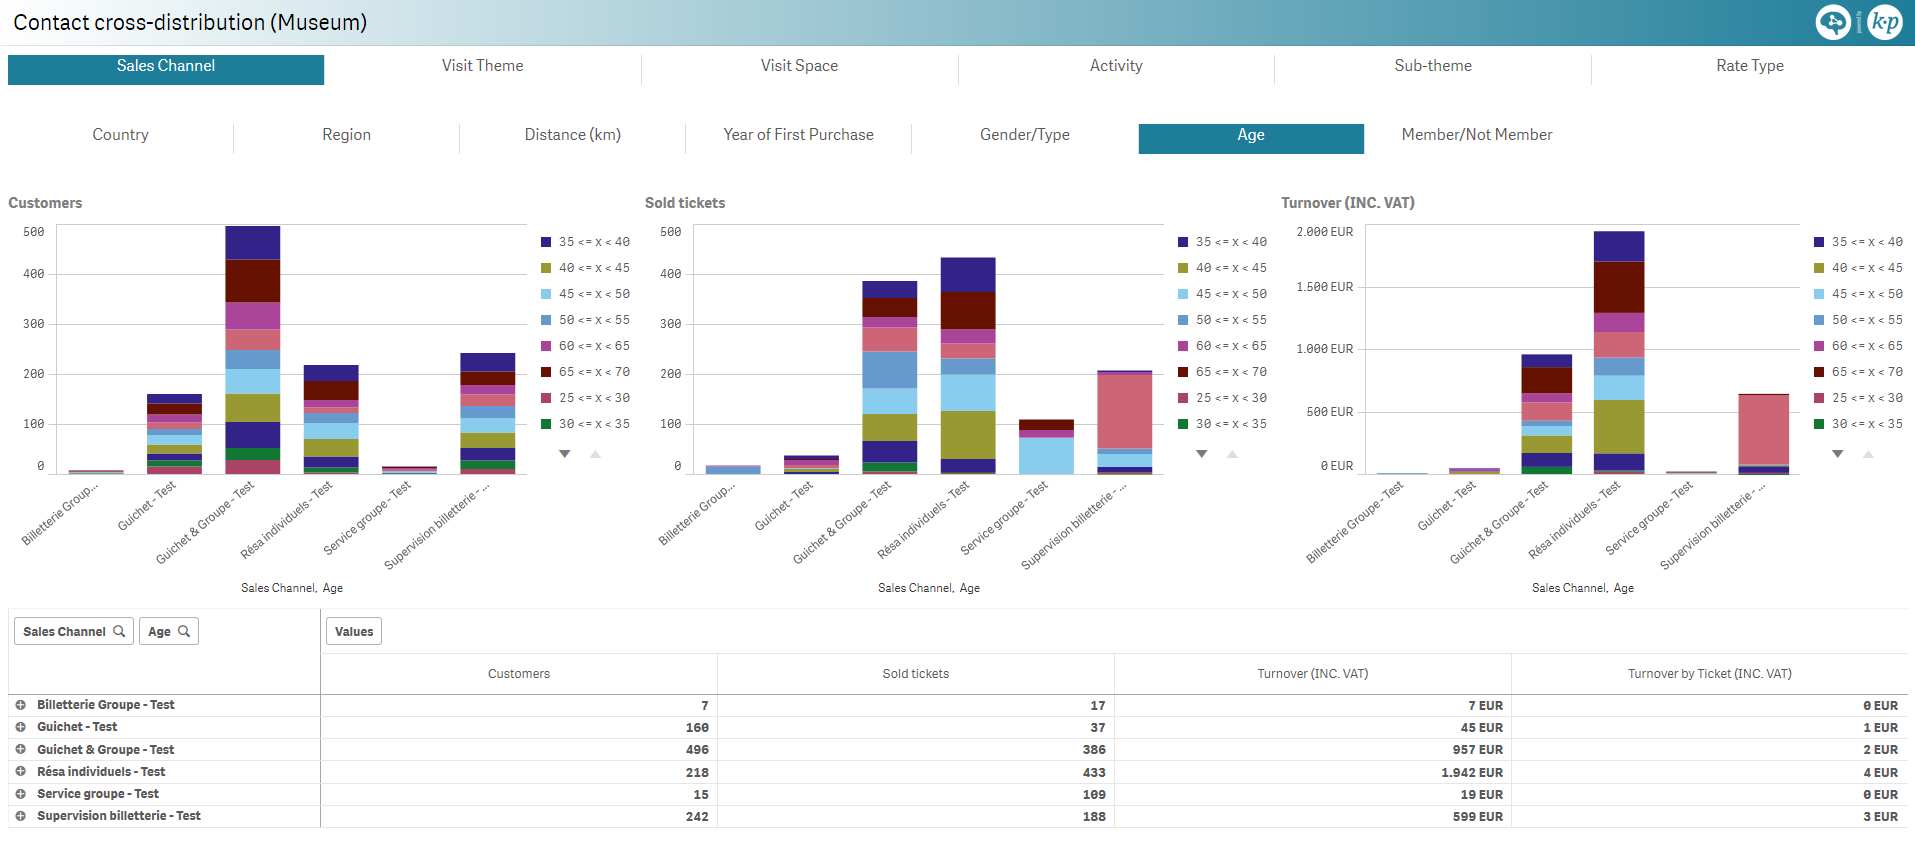
Contact cross-distribution [MU]
Number of customers, sold tickets and revenue
| distributed per | and split by |
|---|---|
|
|
Pivot table for the selected dimensions and the following measures:
- Number of customers
- Number of sold tickets
- Revenue
- Revenue per ticket
SPORTS CLUBS AND STADIUMS
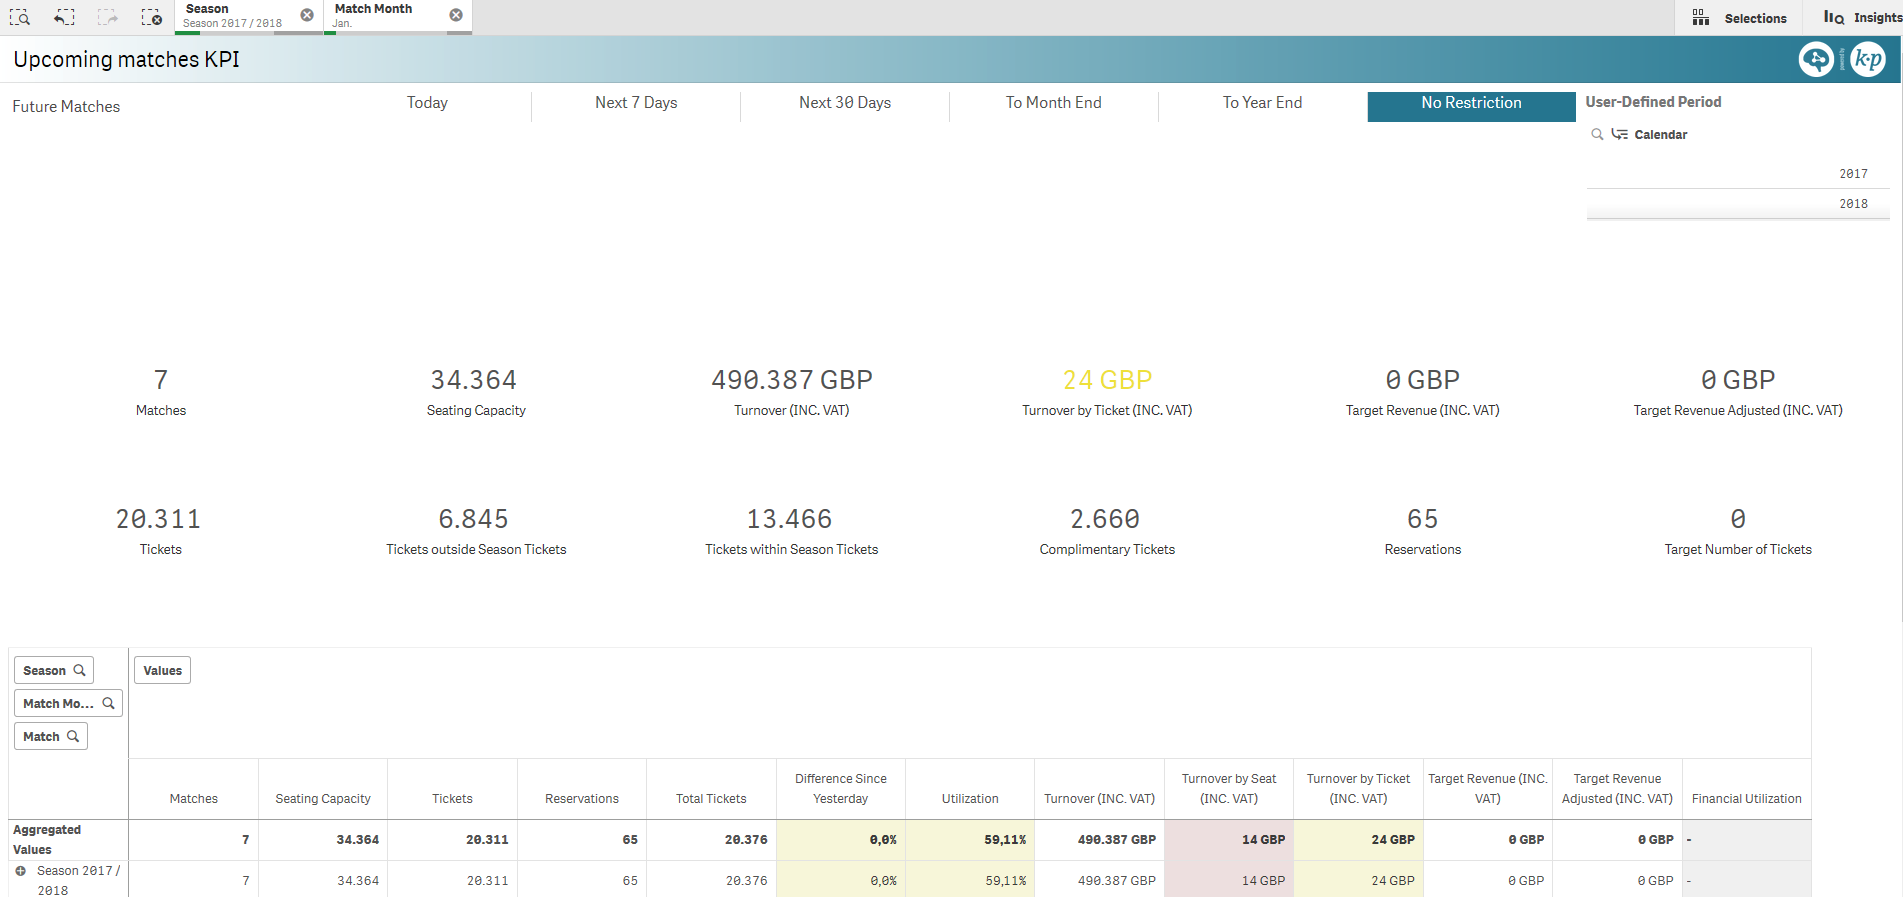
Upcoming matches KPI [SP]
Key Performance Indicators (KPI) for the upcoming matches:
|
|
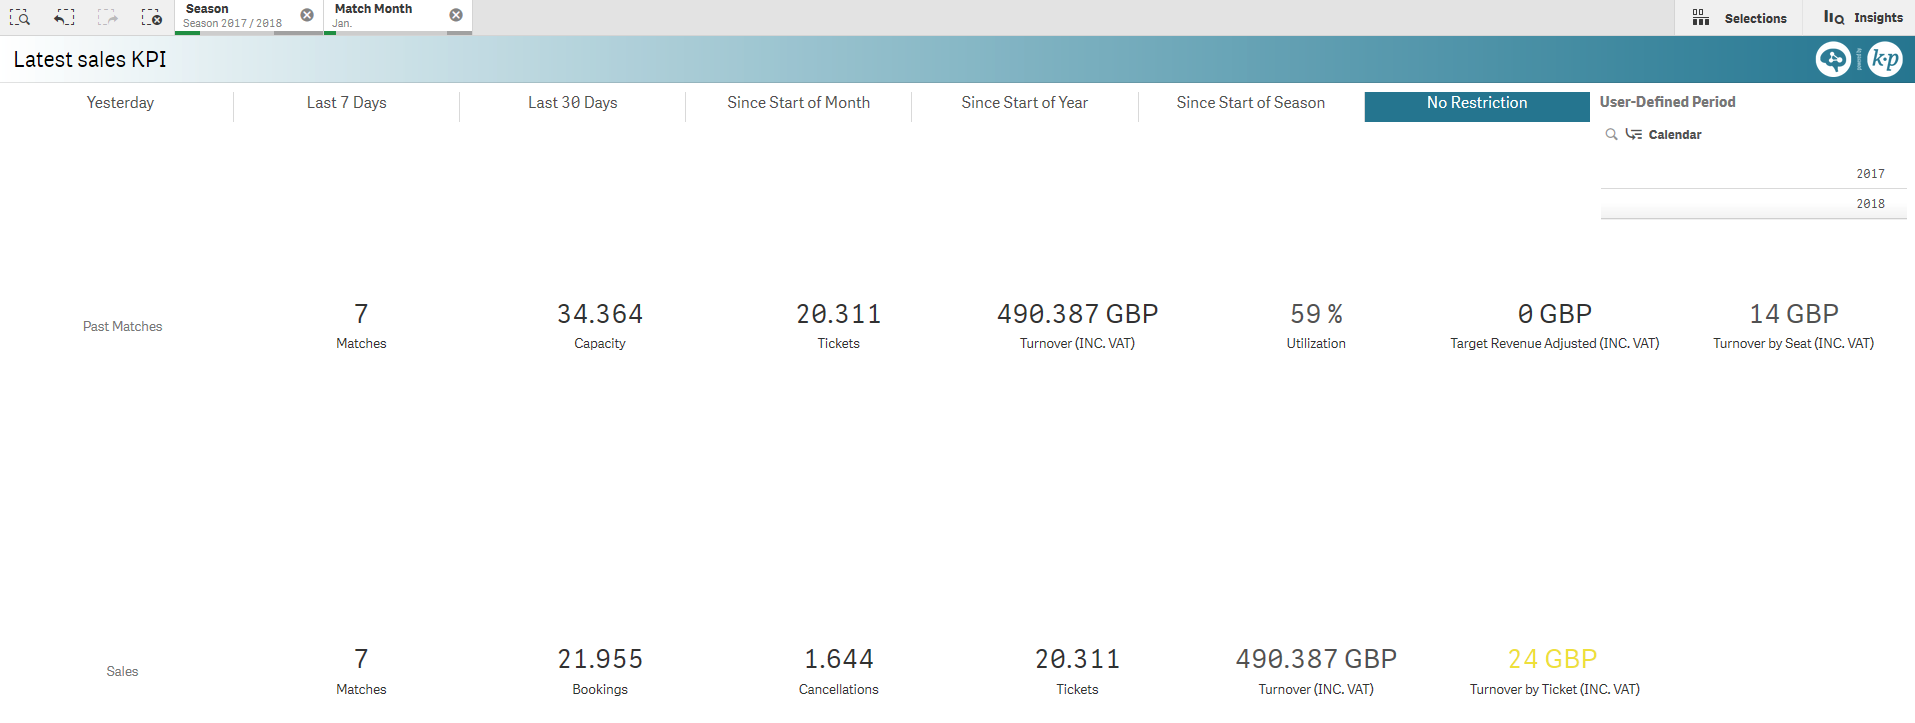
Latest sales KPI [SP]
KPI for the latest matches (based on match date) and sales (based on sales date), compared with the previous period:
| Past matches | Sales |
|---|---|
|
|
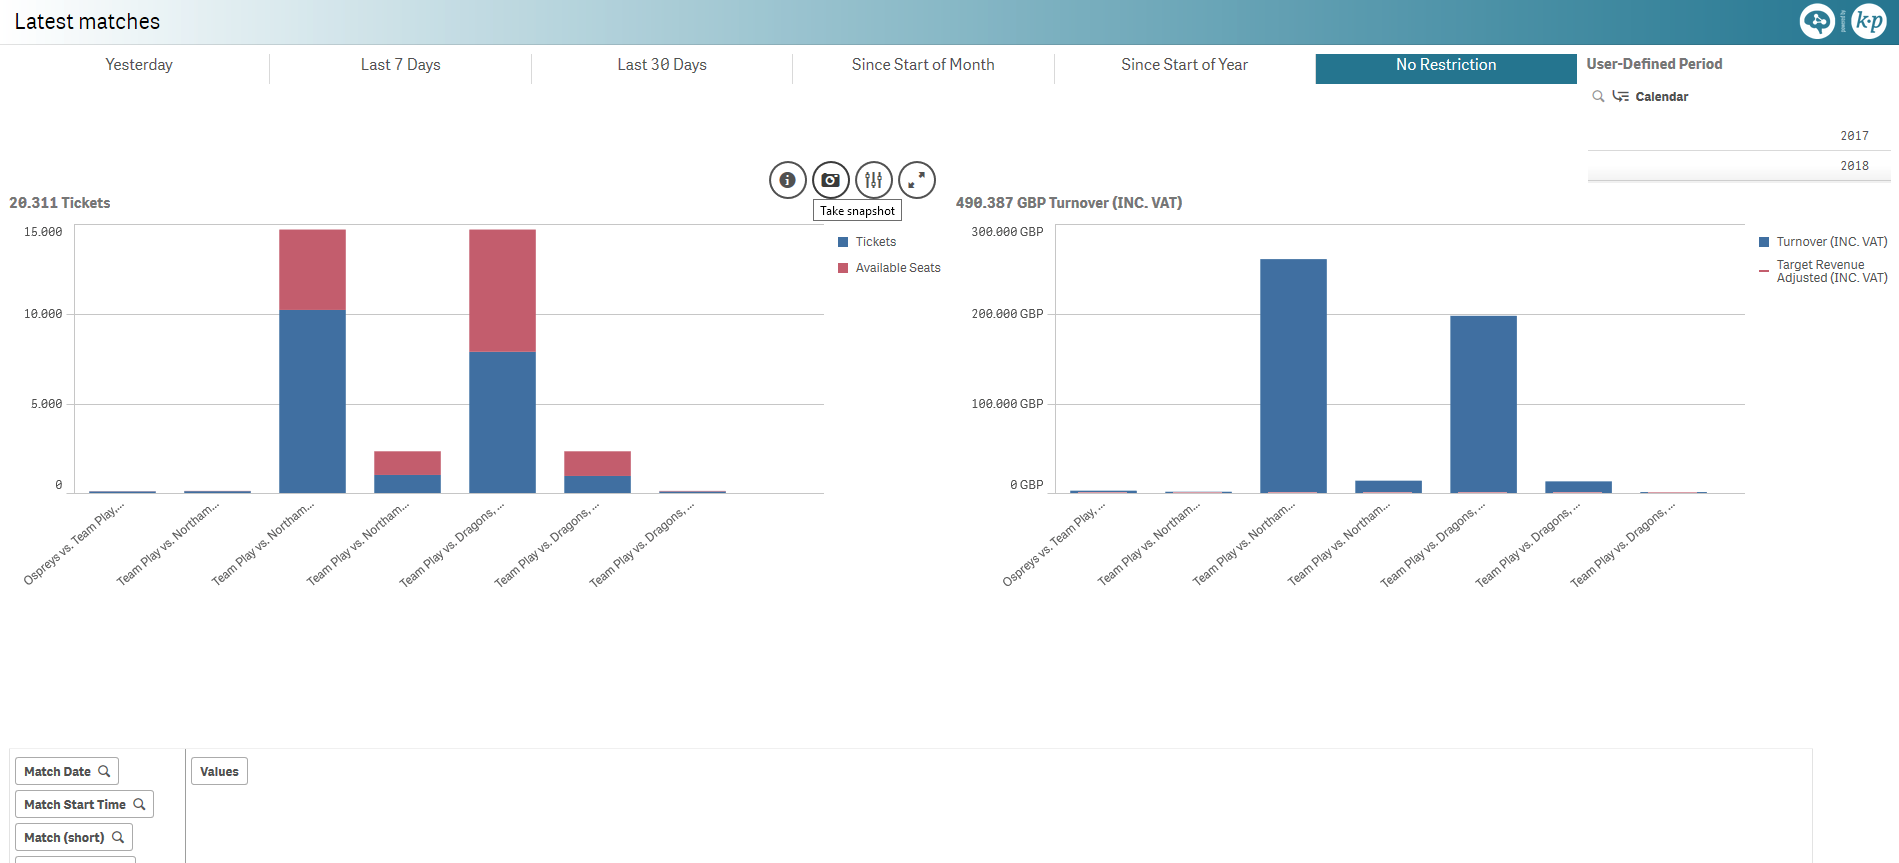
Latest matches [SP]
Sold tickets and revenue charts for the latest matches with respect to the full quota and target revenue.
Pivot table by match date, match start time, match and seat category, for the following measures:
- Seating capacity
- Number of sold tickets
- Capacity utilization
- Revenue
- Revenue per seat
- Revenue per ticket
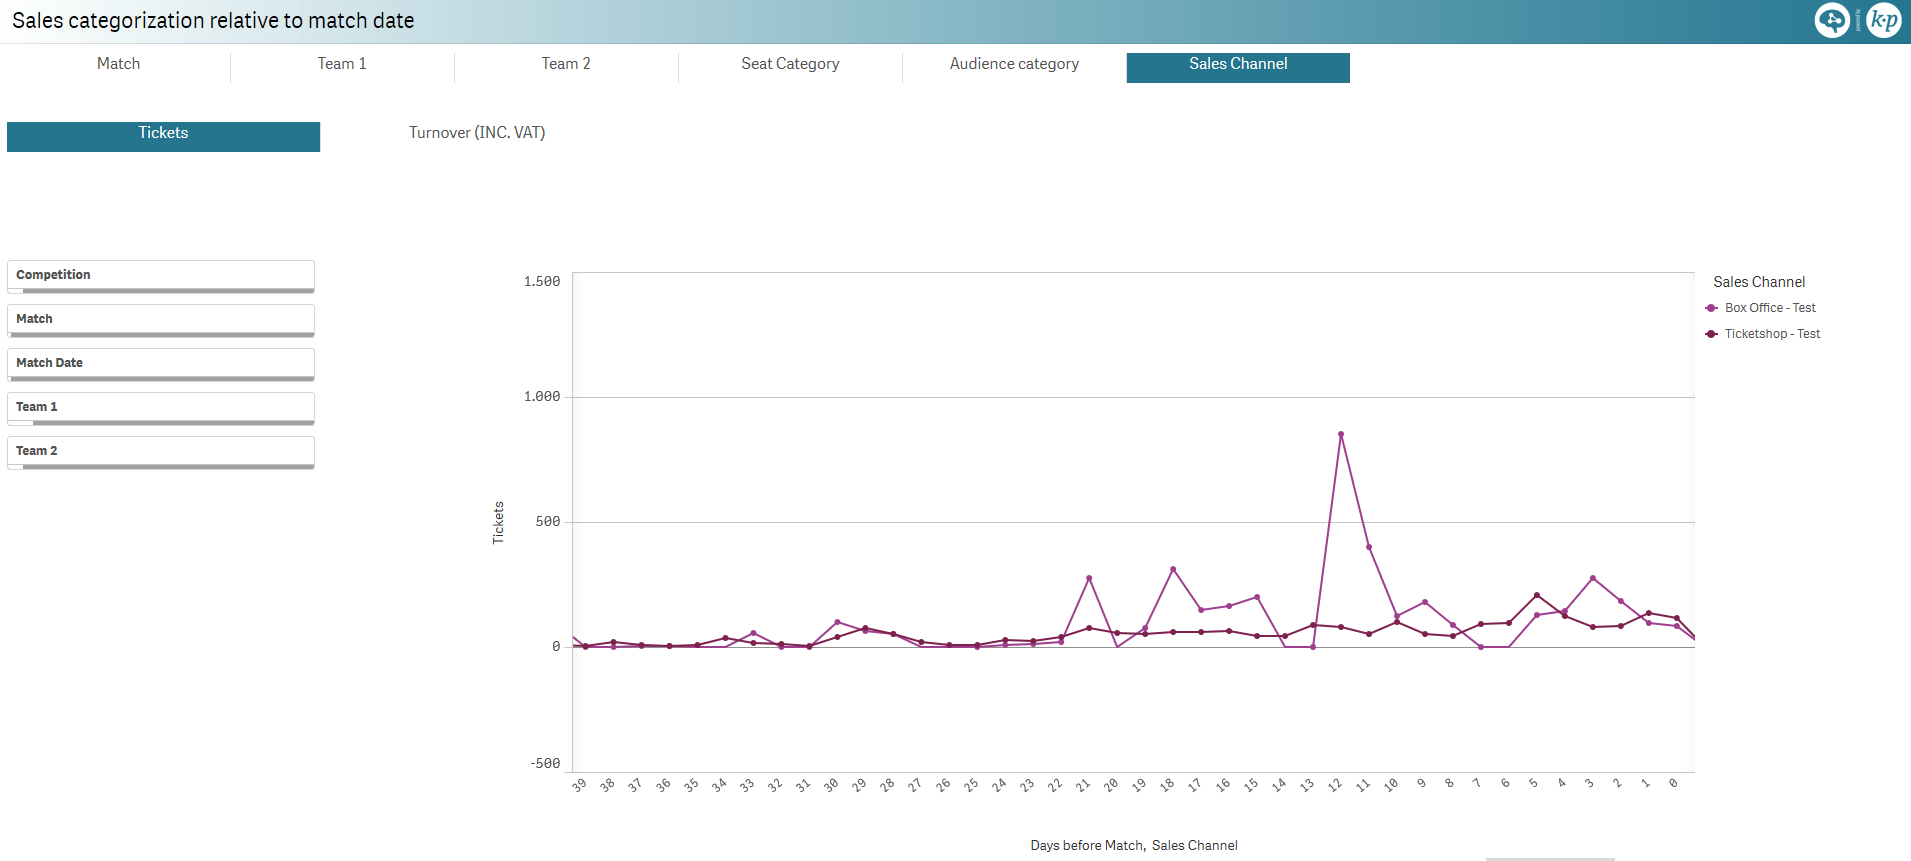
Sales categorization relative to match date [SP]
Comparing sold tickets or revenue with respect to match date for the following dimensions:
Match
Team 1
Team 2
Seat category
Audience category
Sales channel
Includes team logo display.
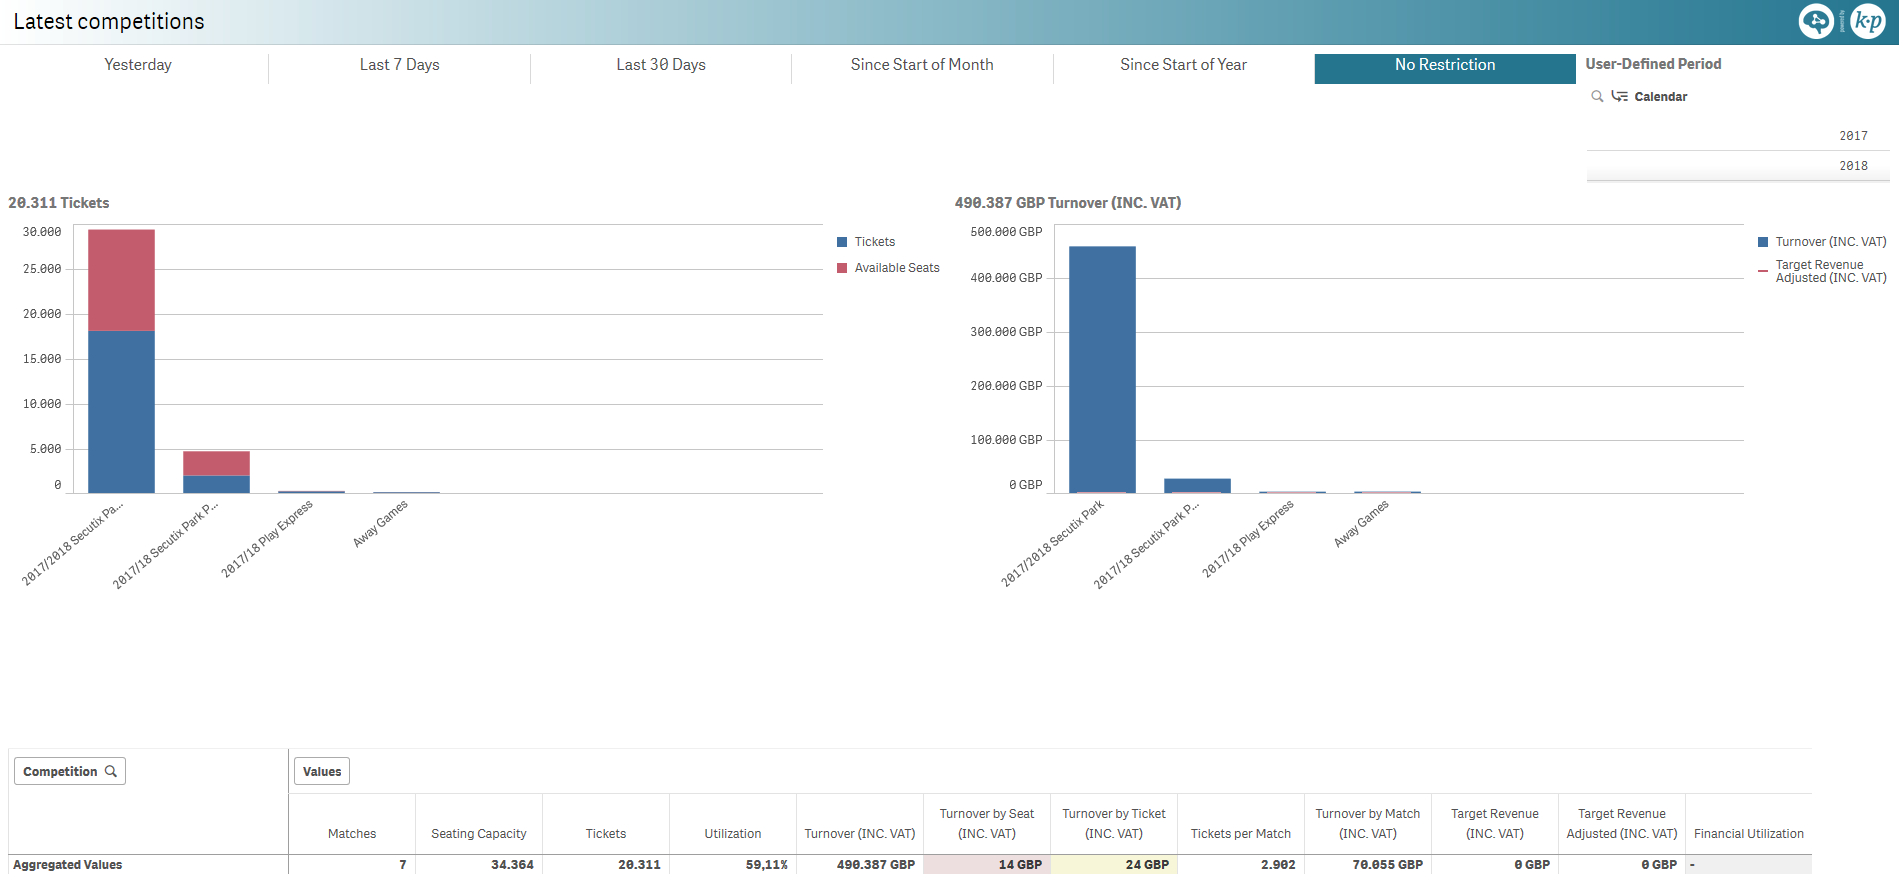
Latest competitions [SP]
Ticket and revenue charts for the latest competitions with respect to the full quota and target revenue respectively.
Pivot table by event for the following measures:
- Number of matches
- Seating capacity
- Number of sold tickets
- Capacity utilization
- Revenue
- Revenue per seat
- Revenue per ticket
- Number of sold tickets per match
- Revenue per match
- Target revenue
- Adjusted target revenue
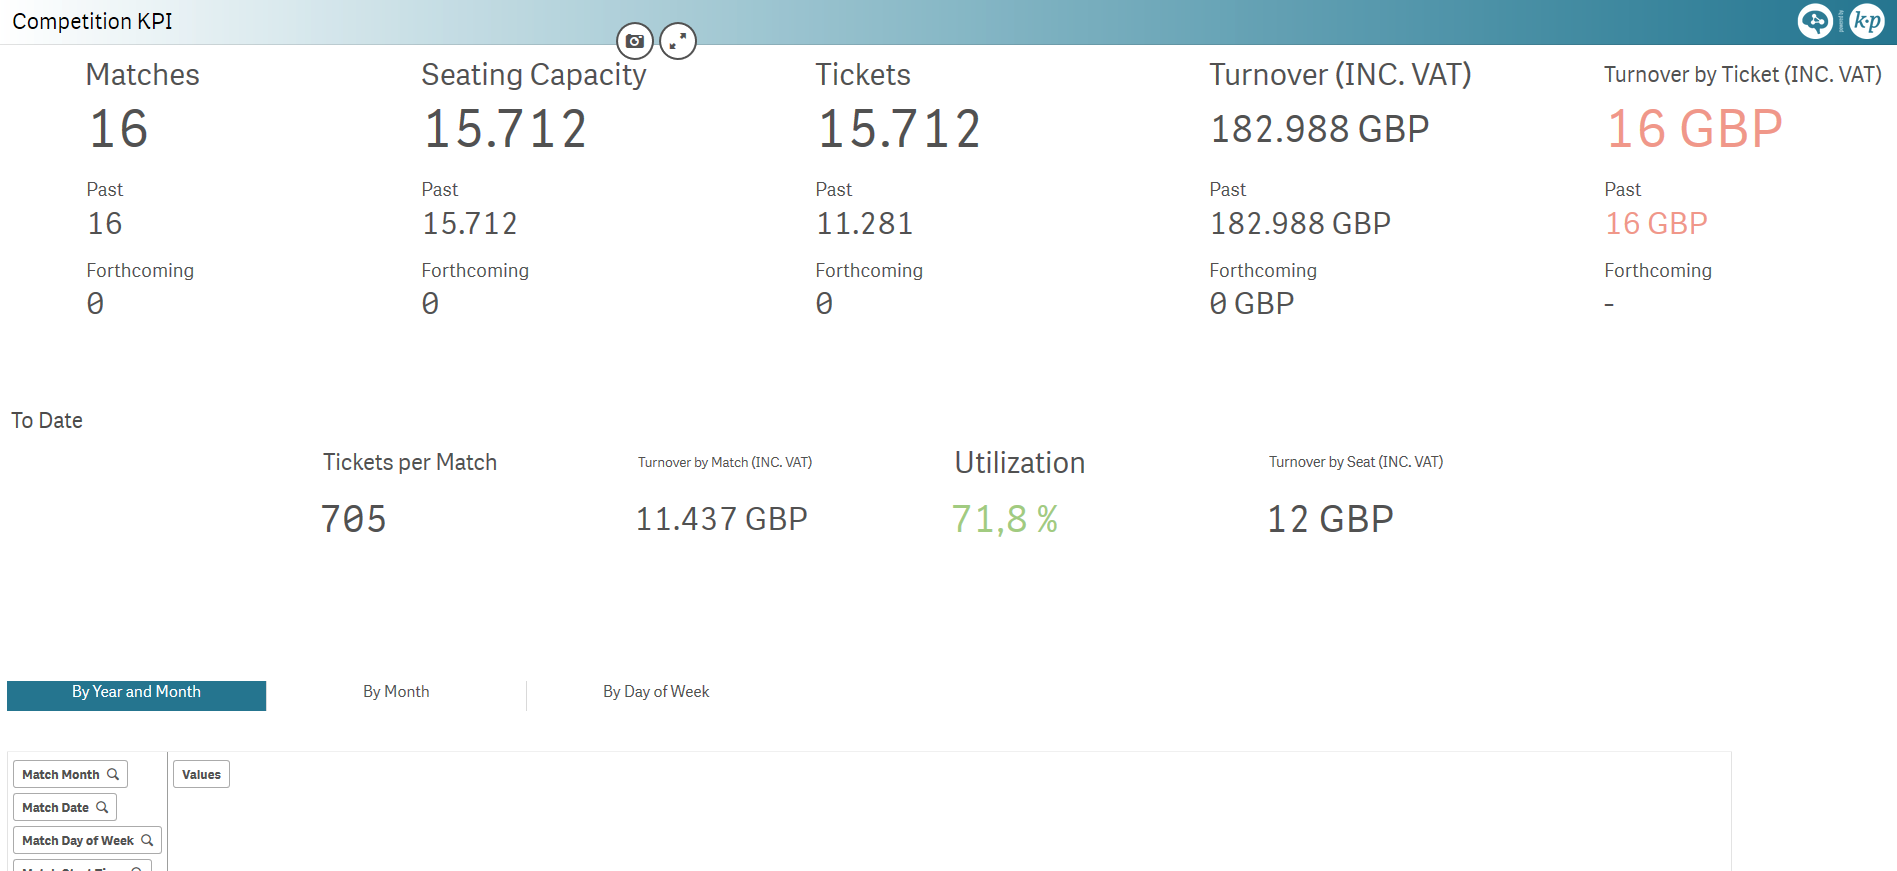
Competition KPI [SP]
KPI for an ongoing competition, with a split on past and forthcoming matches:
Number of matches
Seating capacity
Number of sold tickets
Turnover
Turnover per ticket
and a view on the sales to date for the entire competition:
Number of sold tickets per match
Revenue per match
Capacity utilization
Revenue per seat
Note: Best for a selected competition.
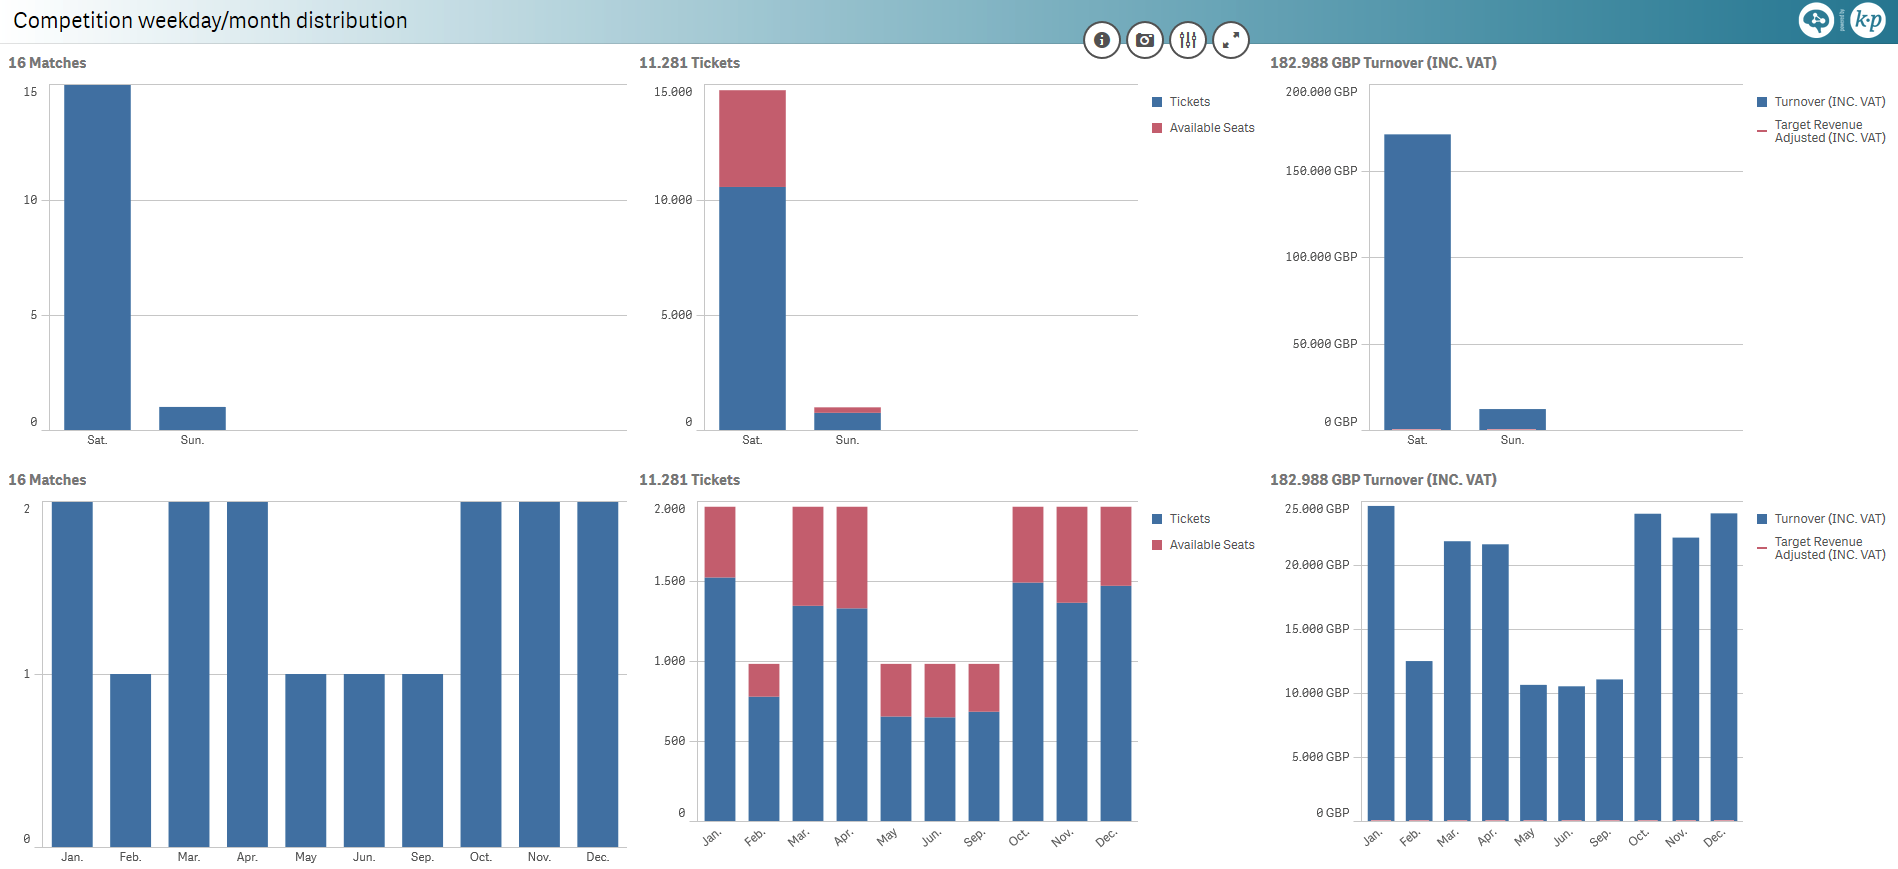
Competition weekday/month distribution [SP]
Number of matches, sold tickets/available seats and revenue/adjusted target revenue charts distributed over:
days of the week
months
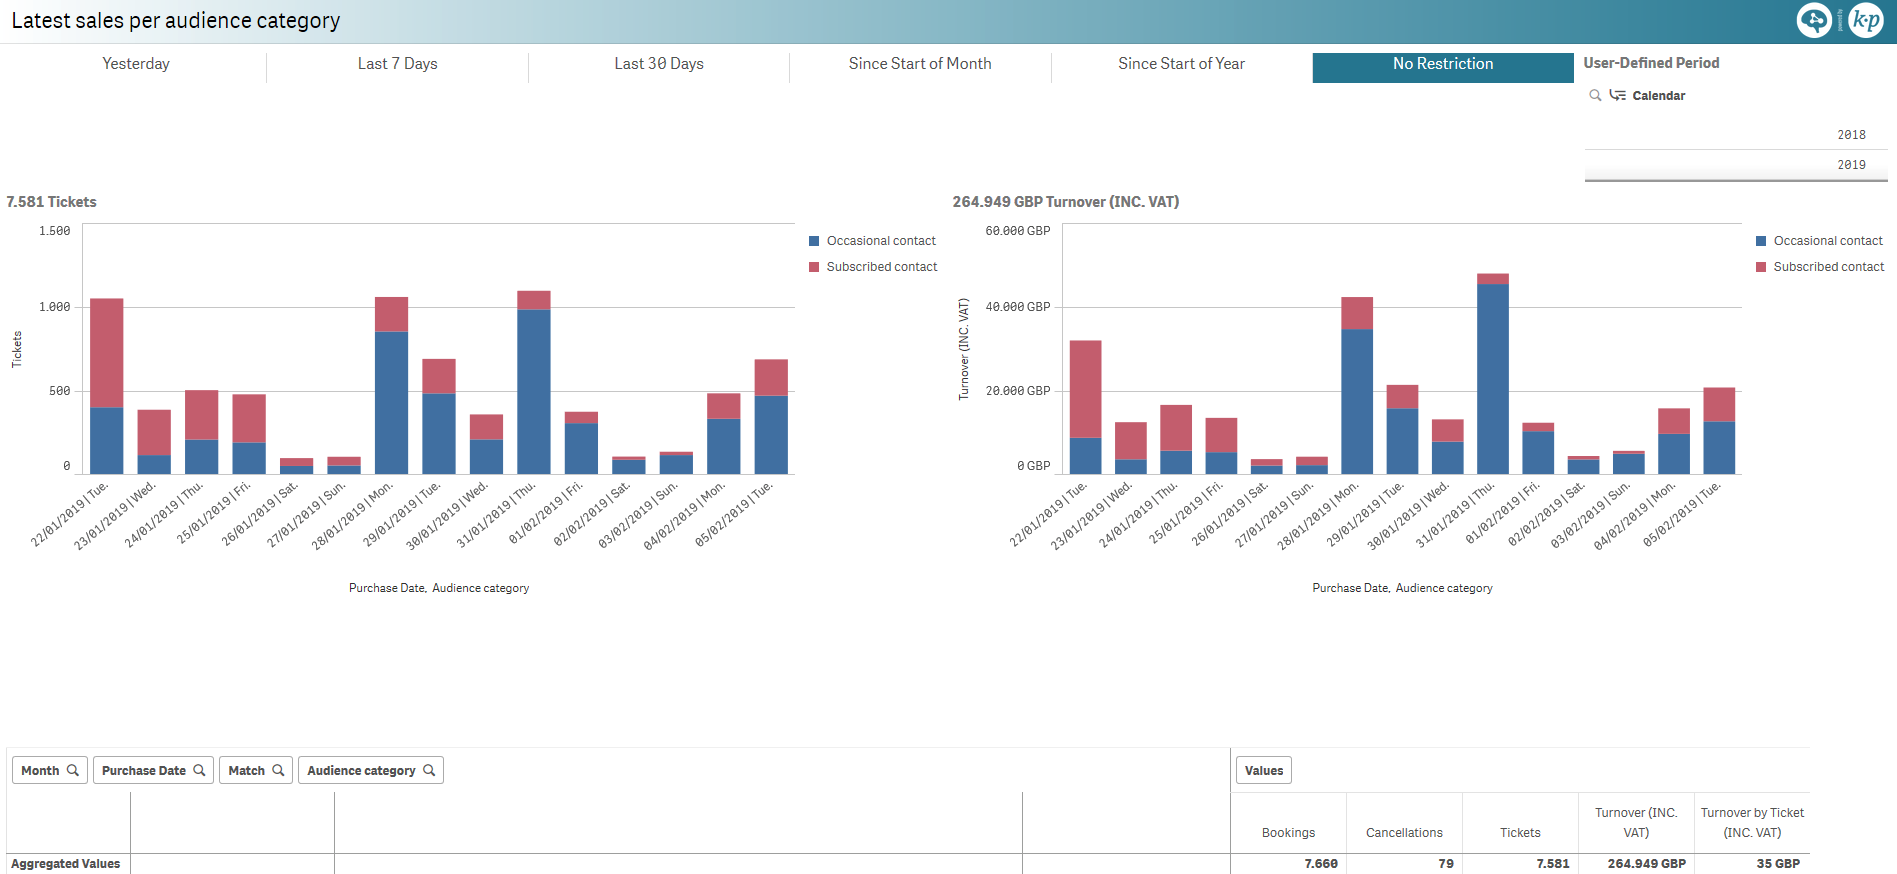
Latest sales per audience category [SP]
Latest ticket sales and revenue per sales date, split by audience category.
Pivot table by purchase month, purchase date, match and audience category for the following measures:
- Number of sold tickets (including cancellations)
- Number of cancellations
- Number of sold tickets
- Revenue
- Revenue per ticket
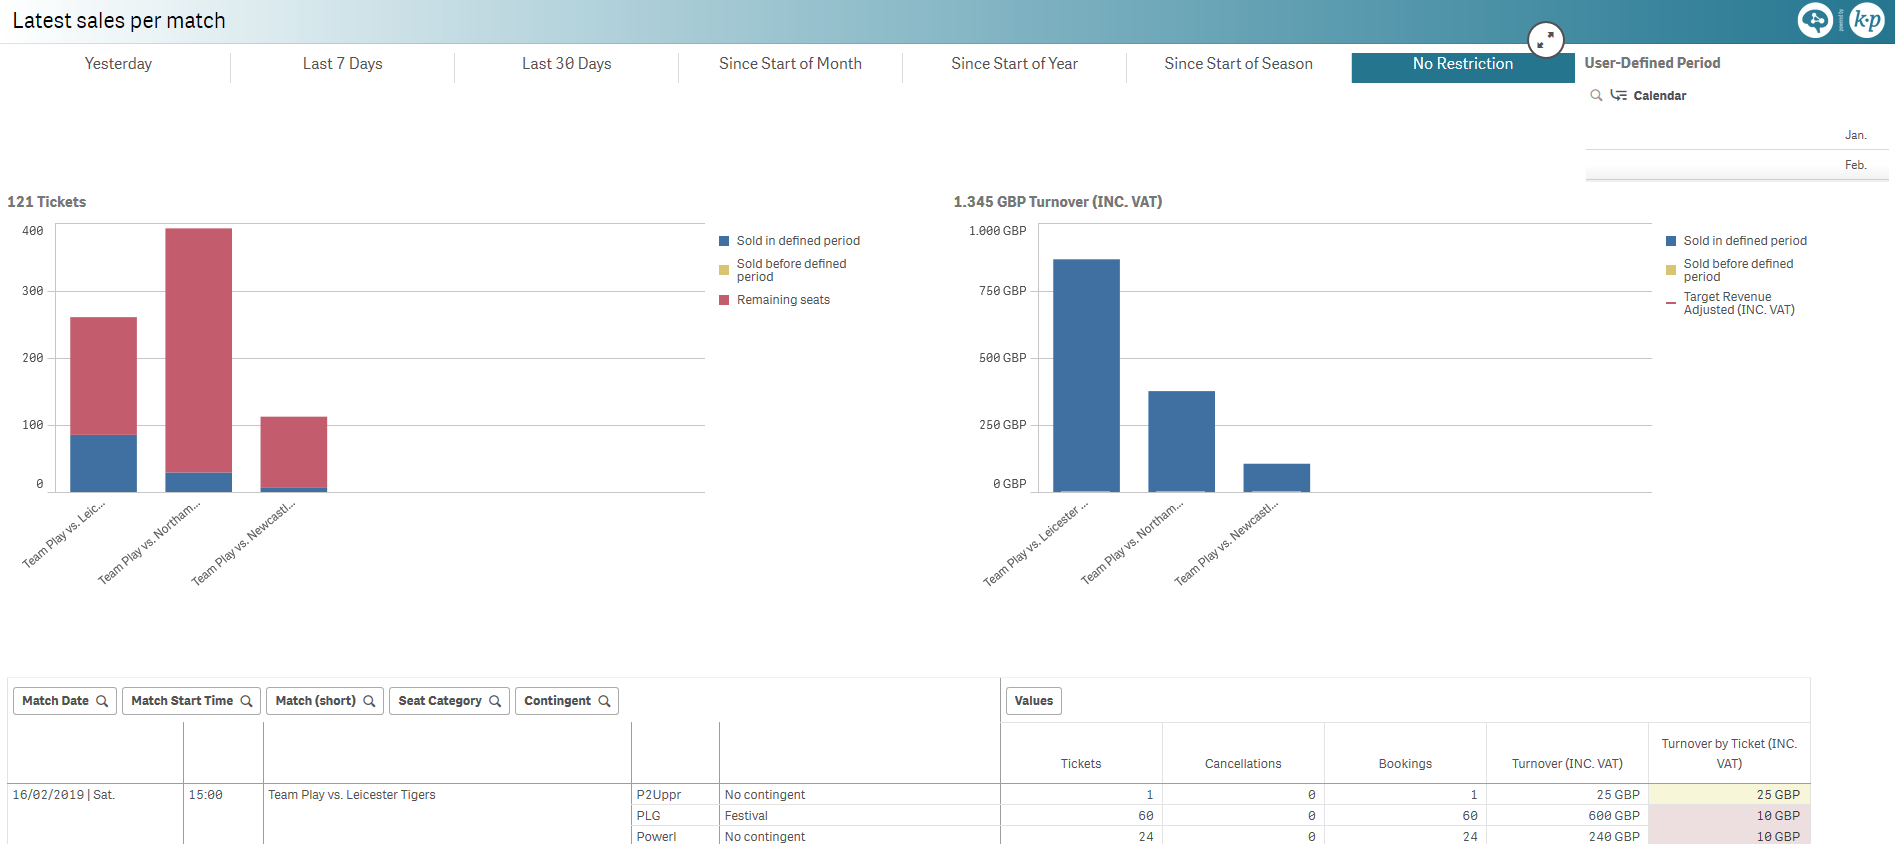
Latest sales per match [SP]
Sold tickets/available seats and revenue/adjusted target revenue per match, split between latest sales and prior sales.
Pivot table by match date, match start time, match, seat category and contingent for the following measures:
- Number of sold tickets
- Number of cancellations
- Number of sold tickets (including cancellations)
- Revenue
- Revenue per ticket
Year/season comparison [SP]
Sold tickets and revenue monthly comparison over two seasons or years, including cumulative numbers.
Pivot table by month of the match, competition and site for the following measures of each selected periods and the differences:
- Number of matches
- Number of sold tickets
- Capacity utilization
- Revenue
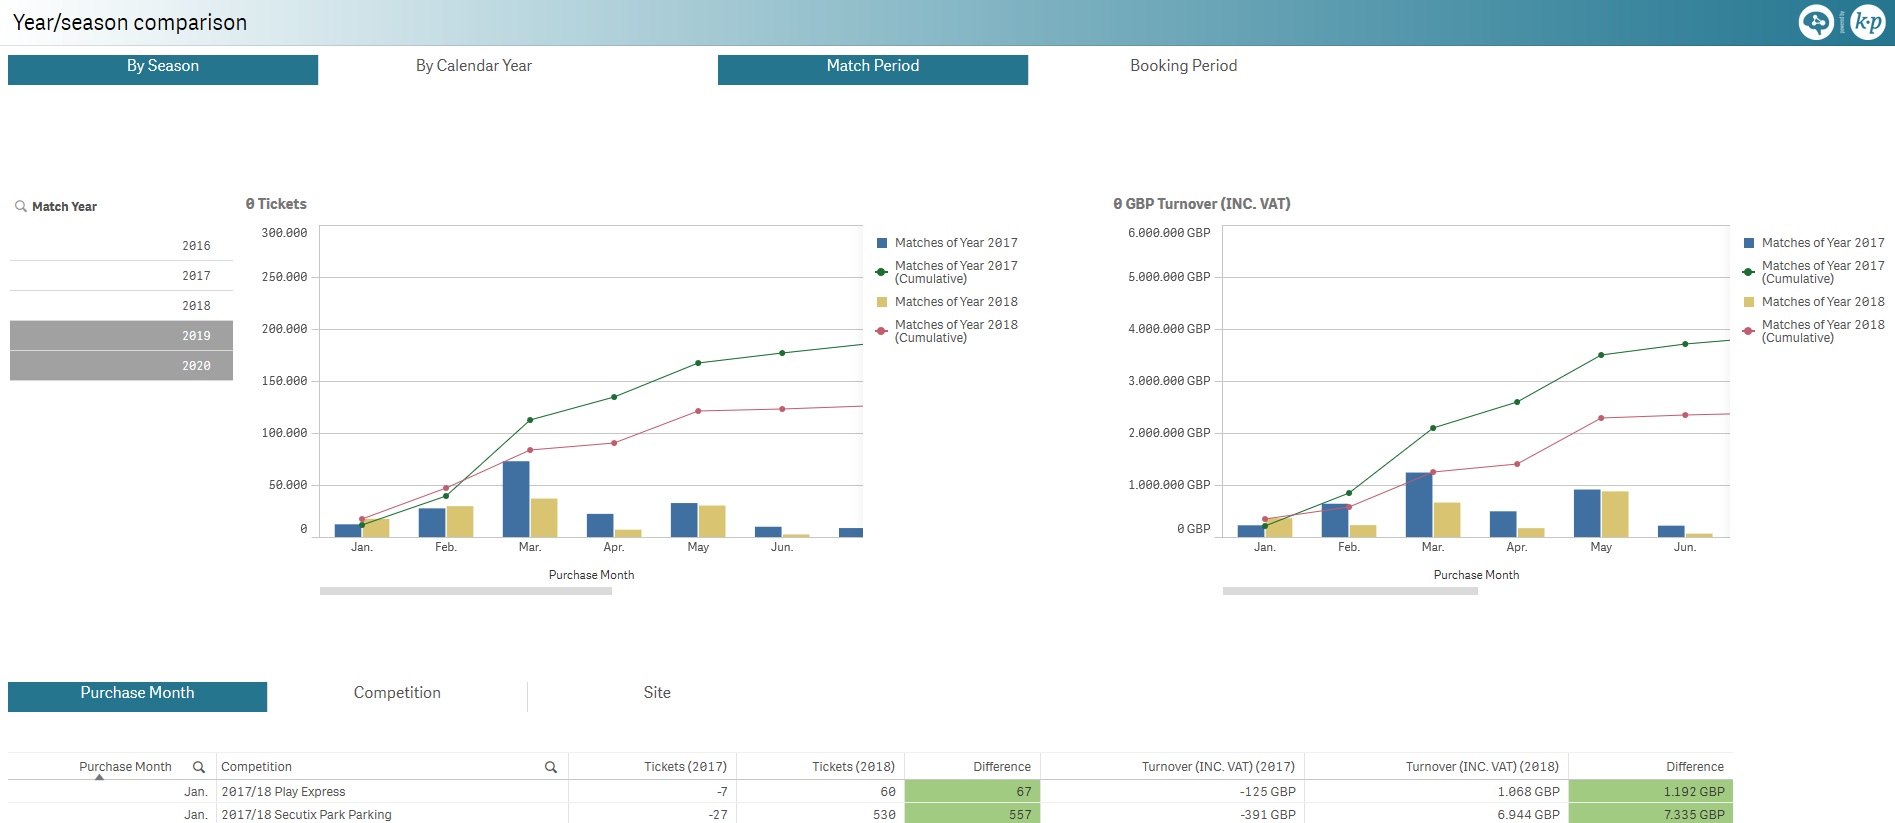
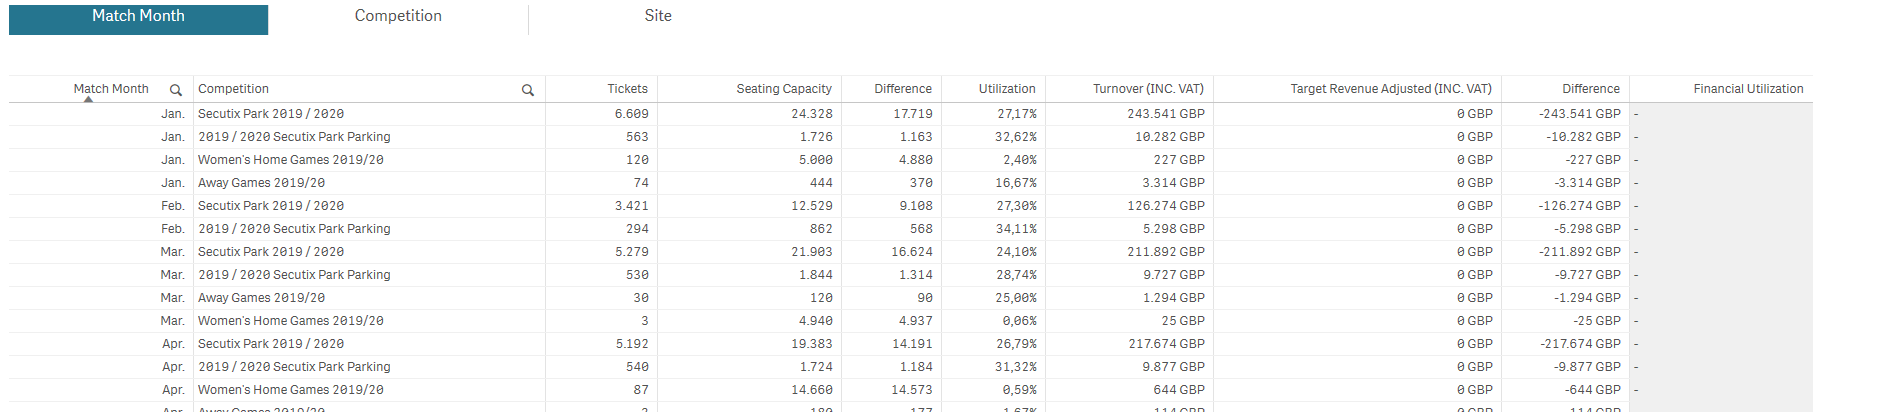
Utilization per month [SP]
Sold tickets and revenue monthly comparison with respect to the full quota and target revenue respectively.
Pivot table by month of the match, competition and site for the following measures:
- Number of sold tickets
- Seating capacity
- Difference between the seating capacity and the number of sold tickets
- Capacity utilization
- Revenue
- Adjusted target revenue
- Difference between the adjusted target revenue and the revenue
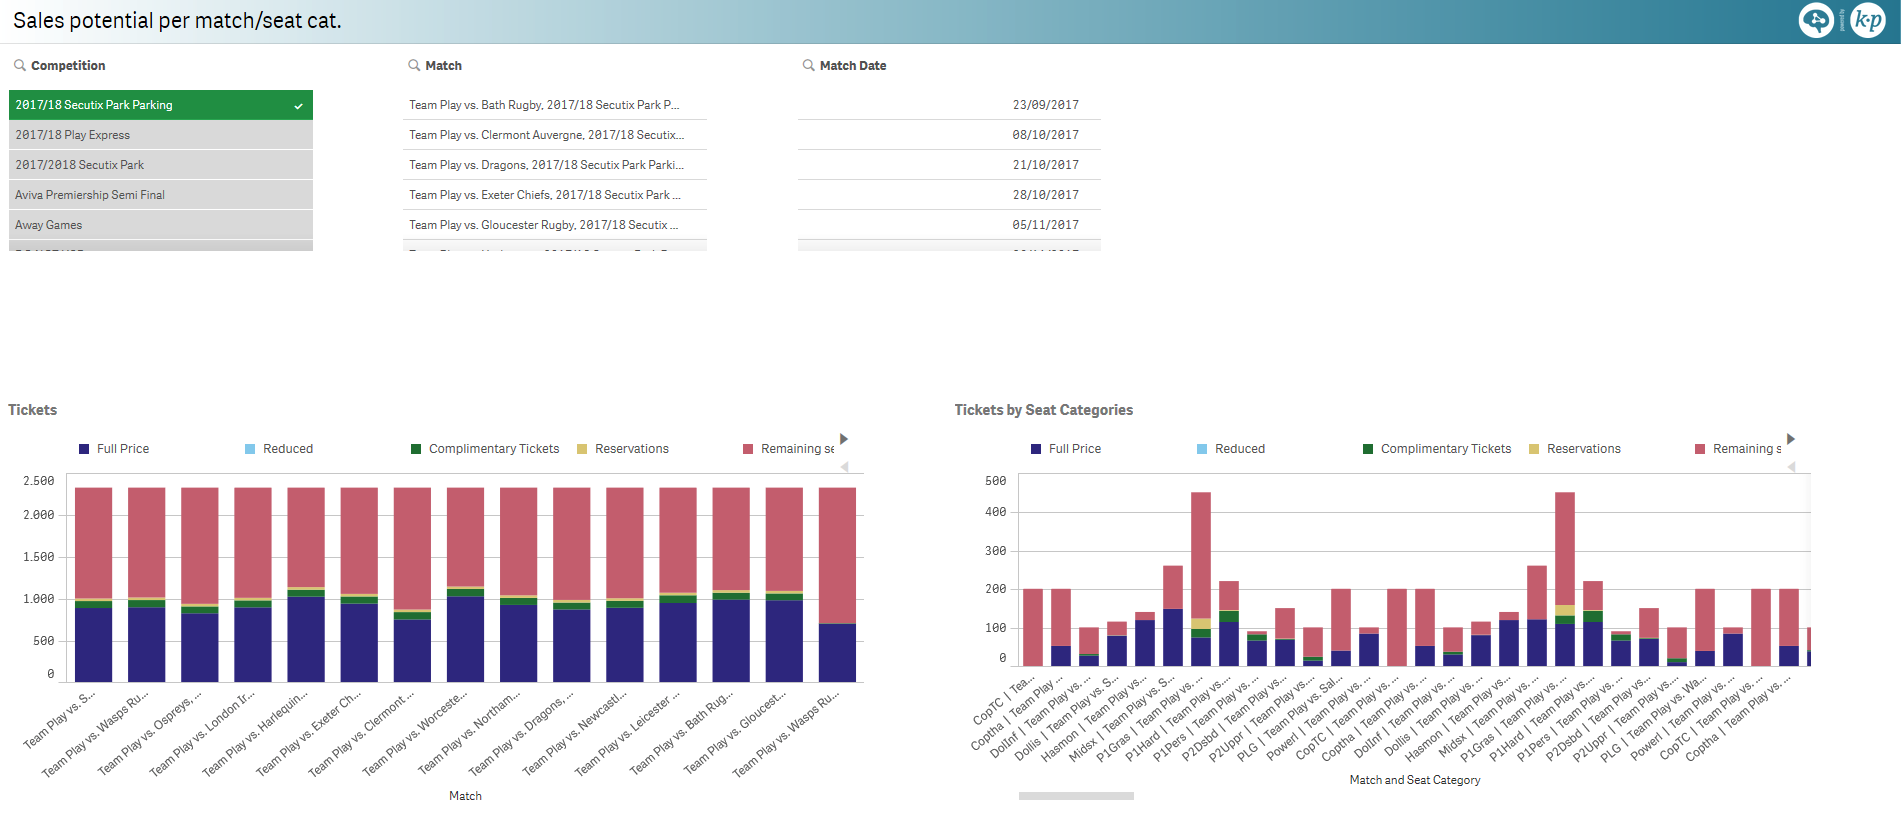
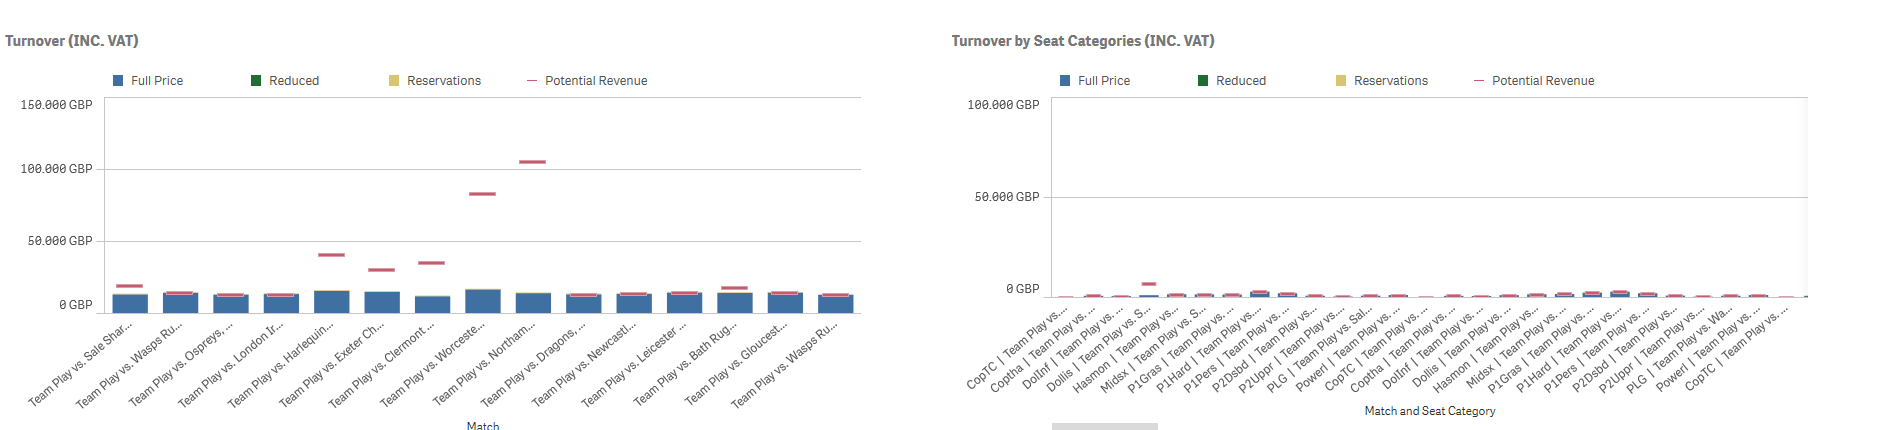
Sales potential per match/seat cat. [SP]
Sold tickets and revenue distributed per match and per seat category and match, split by:
- Full price
- Reduced
- Complementary tickets
- Reservations
- Remaining seats
- Potential revenue
Reservations and remaining seats allow working on optimizing potential sales.
Configuration seat map [SP]
Seat map view of the configuration for a given match color coded by either:
- Sectors (area)
- Seat categories
- Contingents
Sales timeline seat map [SP]
Seat map view of the sales status for a given match and at a given point in time, color coded by:
- Type of tickets
- Full price
- Season tickets
- Reduced
- Complementary tickets
- Reserved
- Packages
- Remaining seats
Venue utilization [SP]
Map view of a venue color coded by:
- Utilization: how often a seat is sold
- Revenue: how much revenue a seat generates
- Hot seats: how early a seat is sold
Seasonal utilization [SP]
Match attendance percentage distributed either per:
- Season
- Year
- Month
- Week
- Day
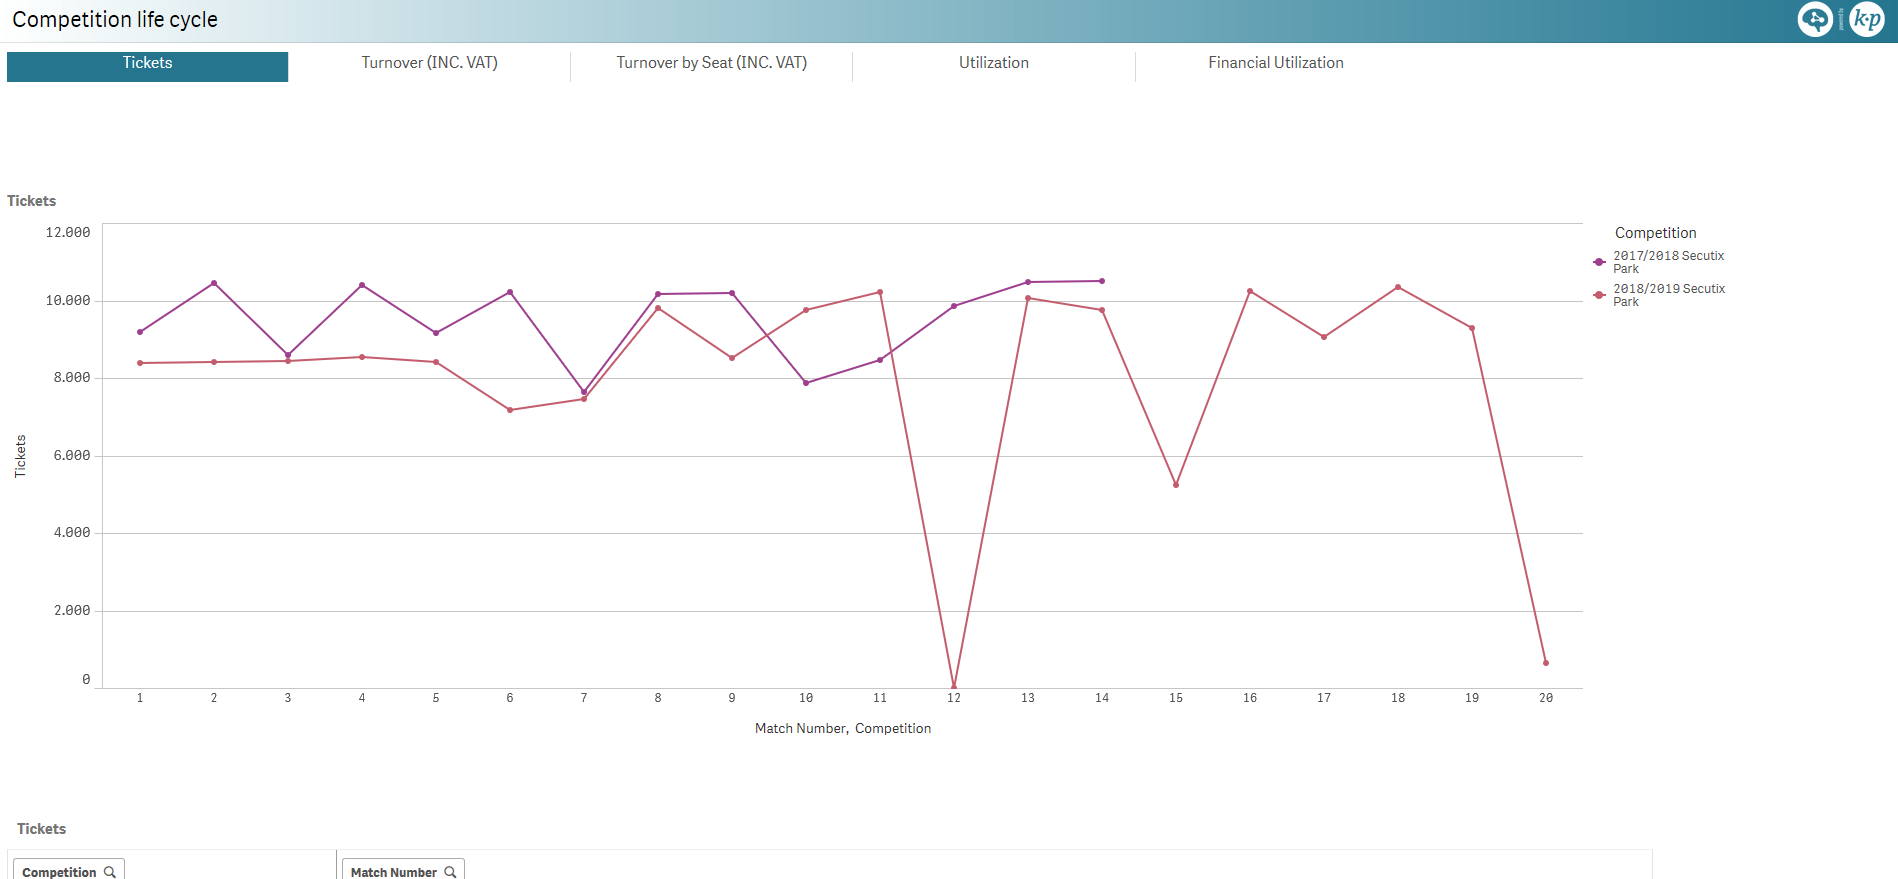
Competition life cycle [SP]
Comparison of competitions by match number with respect to either:
- Number of sold tickets
- Revenue
- Revenue per seat
- Utilization (attendance percentage)
- Financial utilization
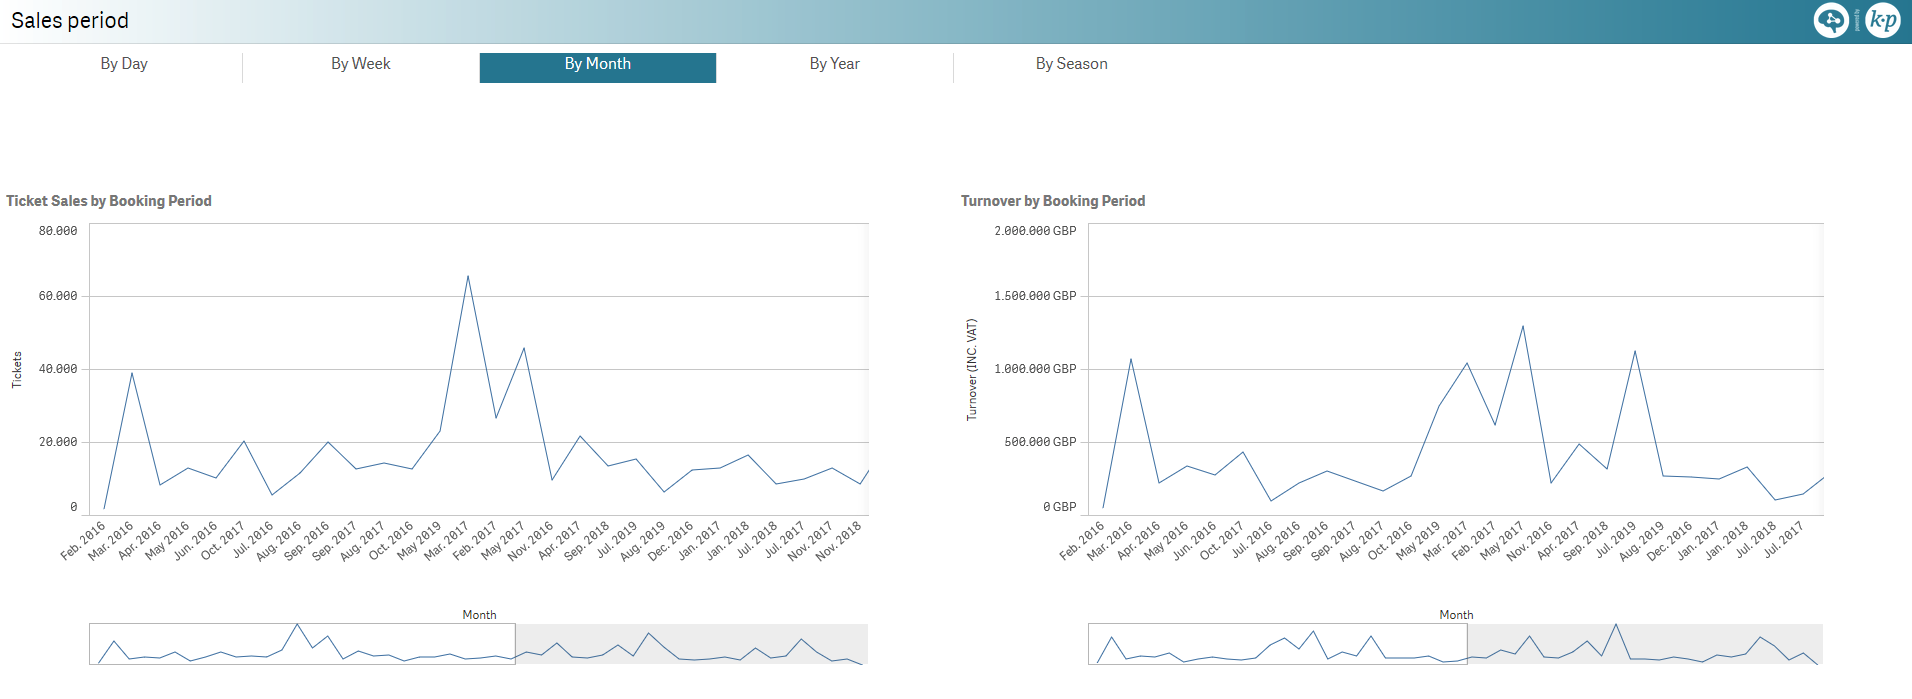
Sales period [SP]
Total sold tickets and revenue by either:
- Day
- Week
- Month
- Season
- Year
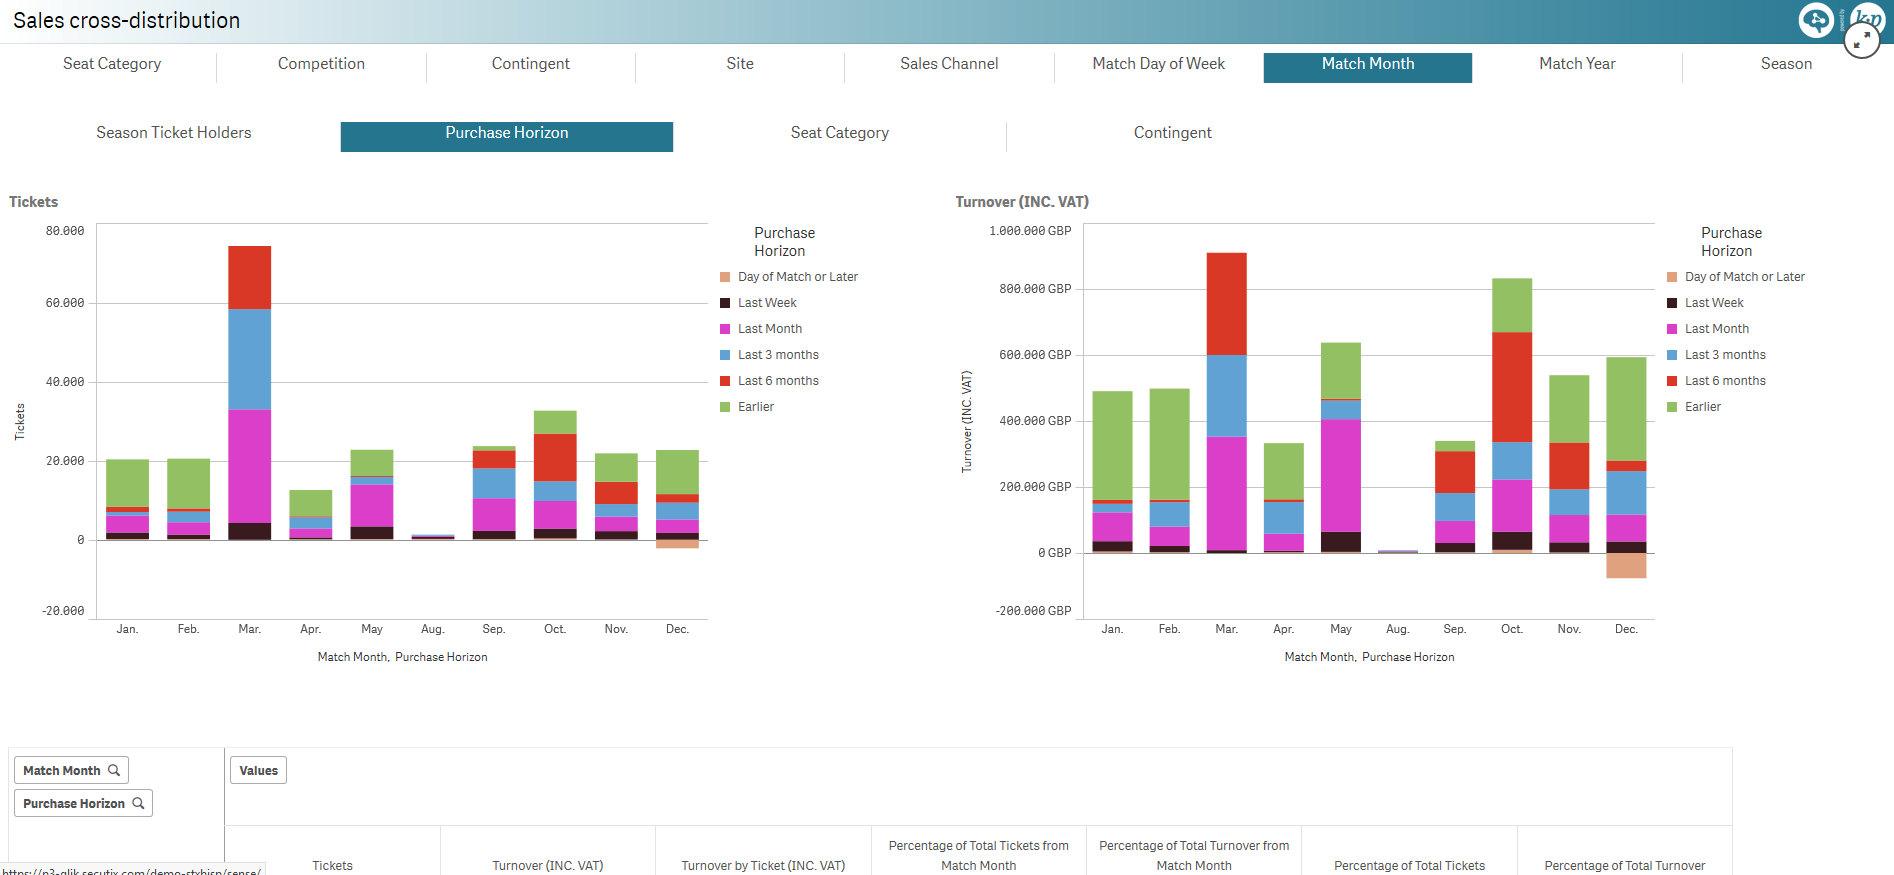
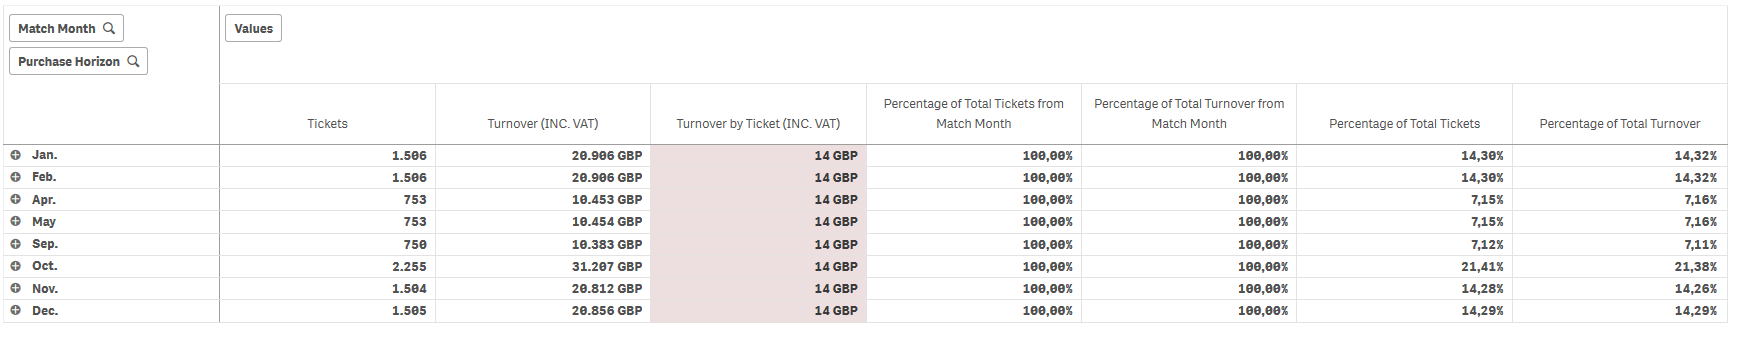
Sales cross-distribution [SP]
Sold tickets and revenue:
| distributed per | and split by |
|---|---|
|
|
Pivot table for the selected dimension and the following measures:
- Number of sold tickets
- Revenue
- Revenue per ticket
- Percentage of total tickets of the selected dimension
- Percentage of revenue of the selected dimension
- Percentage of total tickets
- Percentage of revenue
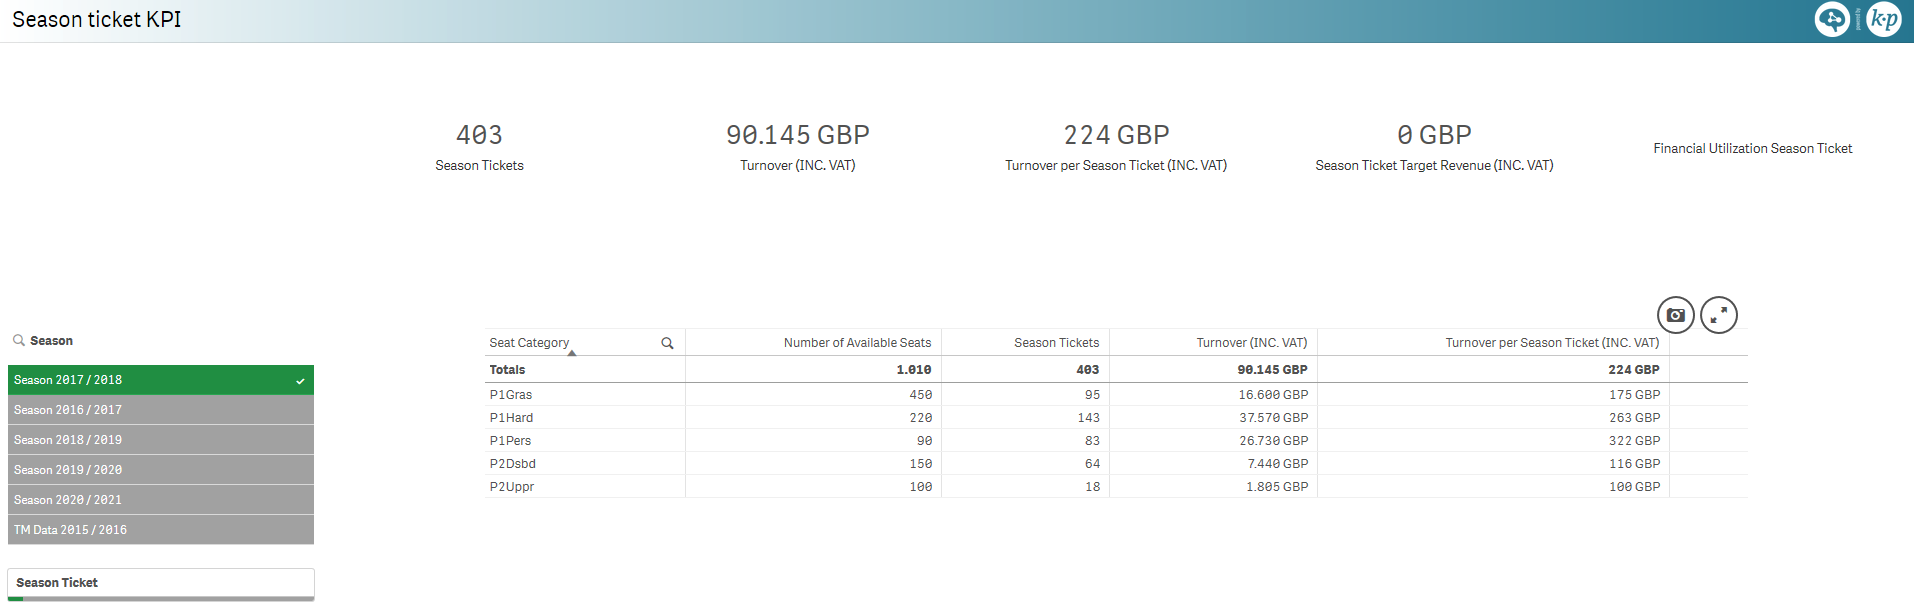
Season ticket KPI [SP]
KPI and pivot table for a season ticket:
- Number of season sold tickets
- Revenue
- Revenue per season ticket
- Season ticket target revenue
- Season ticket financial utilization
Note: Best for a selected season ticket.
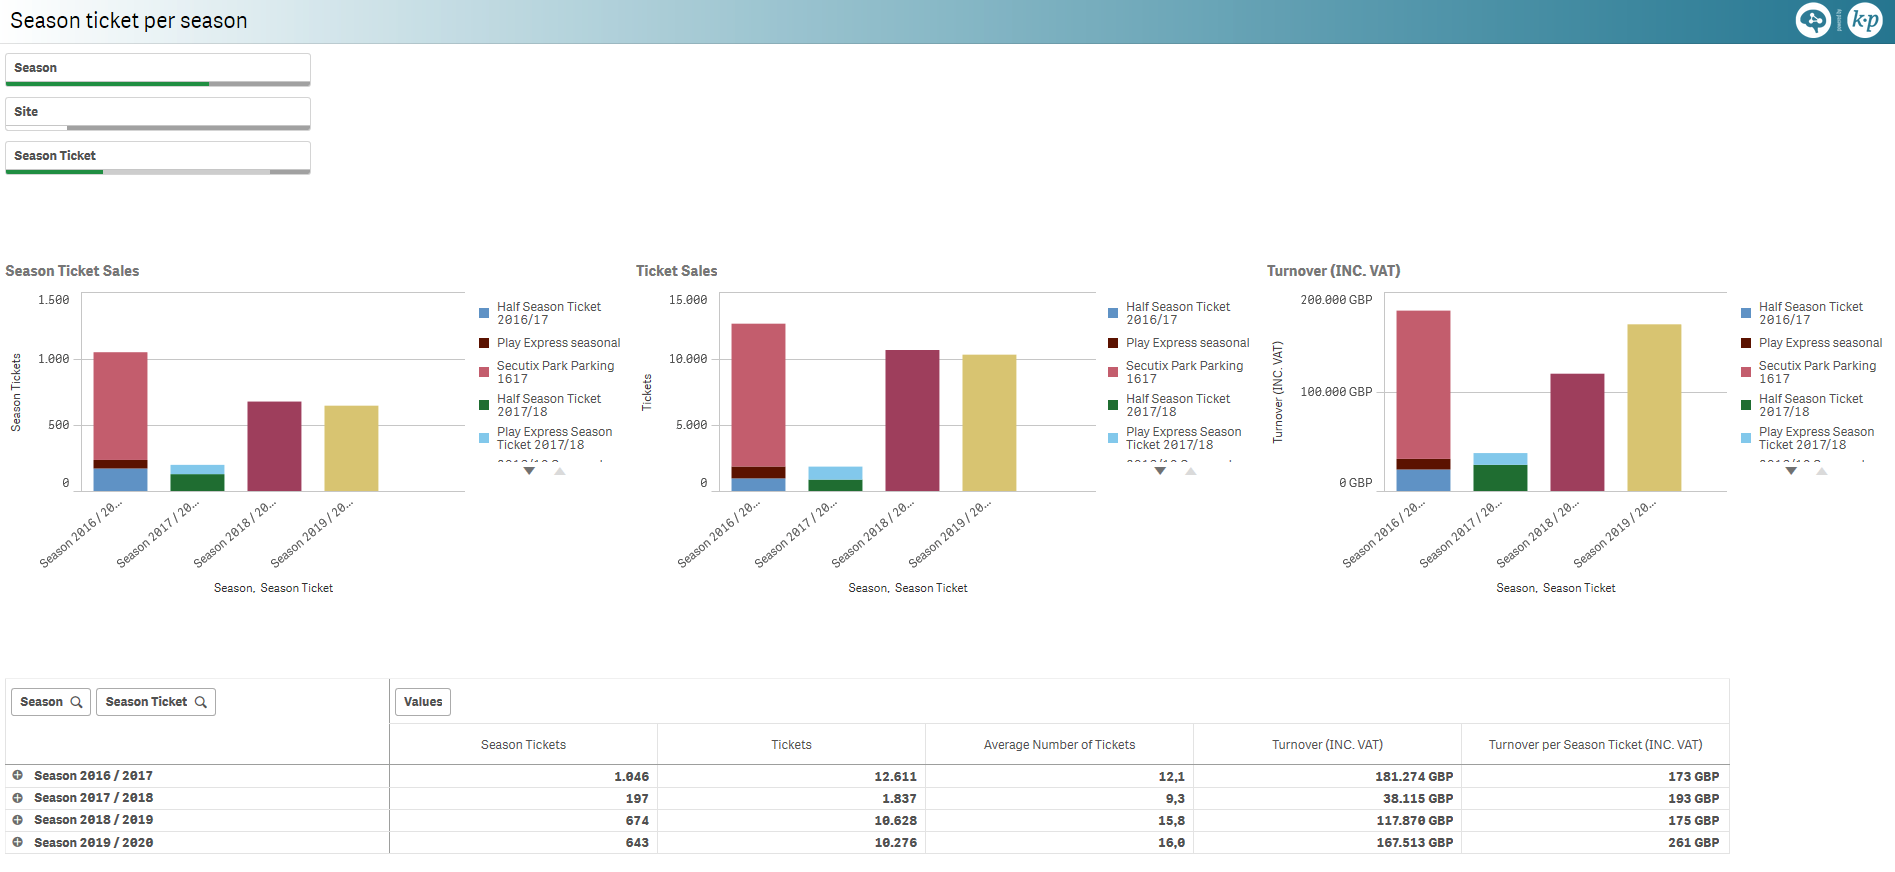
Season tickets per season [SP]
Season ticket sales, sold tickets and revenue distributed per seasons.
Pivot table for the season tickets and the following measures:
- Number of season tickets
- Number of sold tickets
- Average tickets per season ticket
- Revenue
- Revenue per season ticket
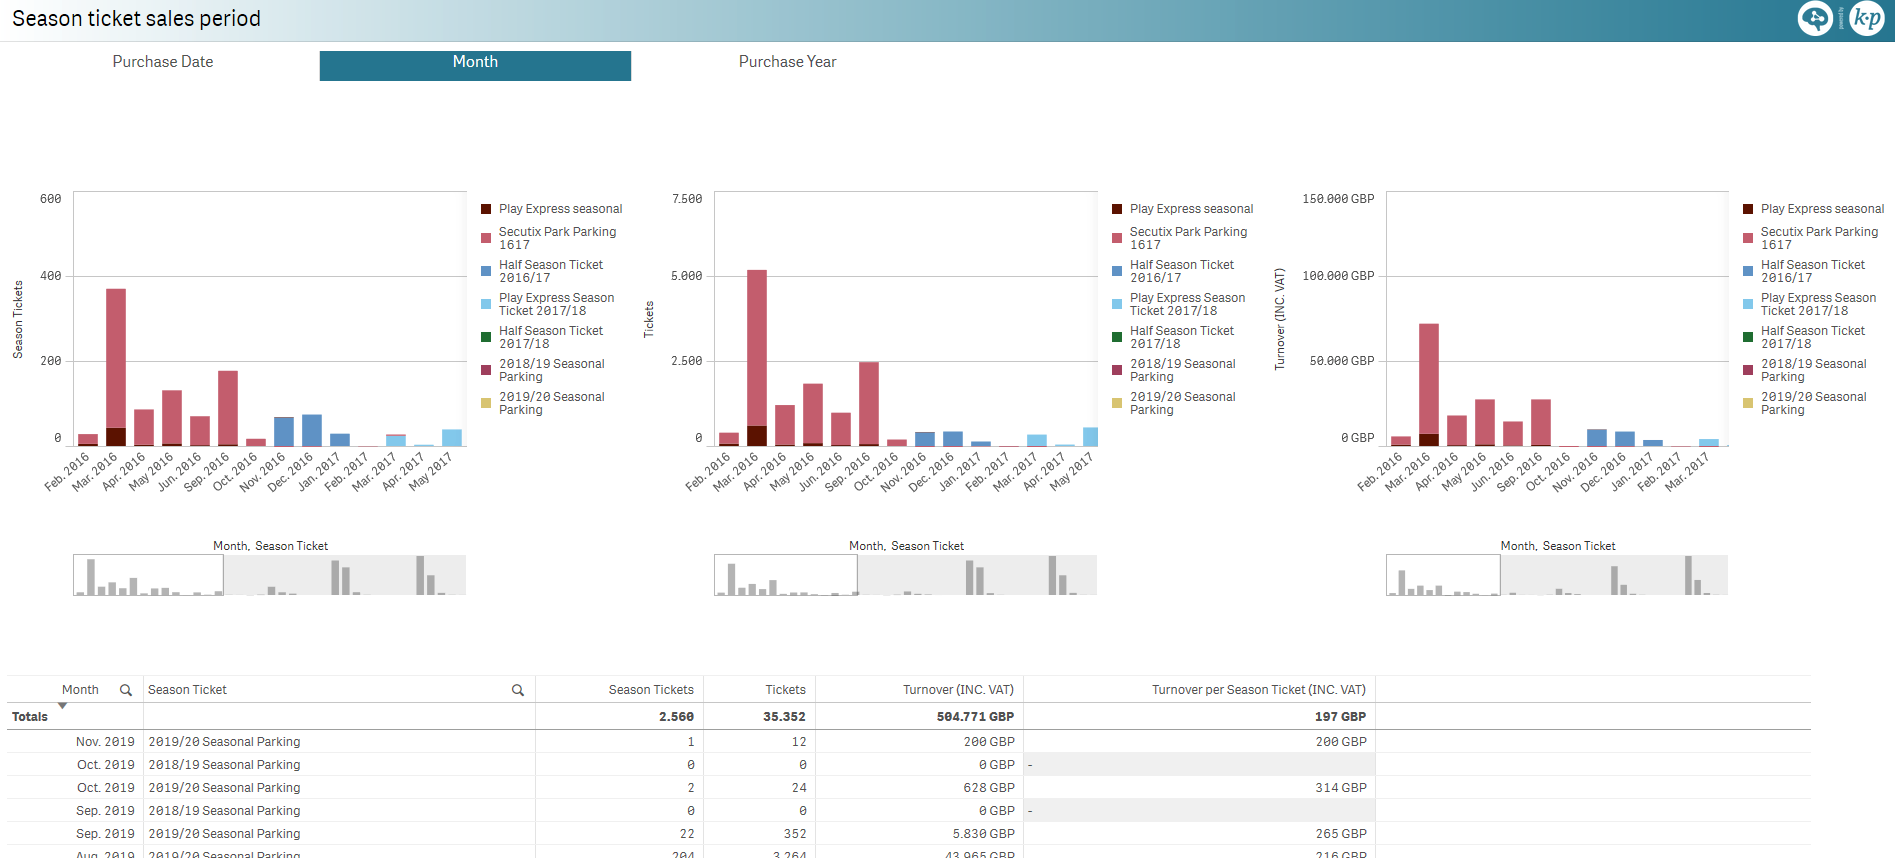
Season ticket sales period [SP]
Season ticket sales, sold tickets and revenue distributed per either:
- Purchase date
- Purchase month
- Purchase year
Pivot table for the selected sales period and the following measures:
- Number of season tickets
- Number of sold tickets
- Revenue
- Revenue per season ticket
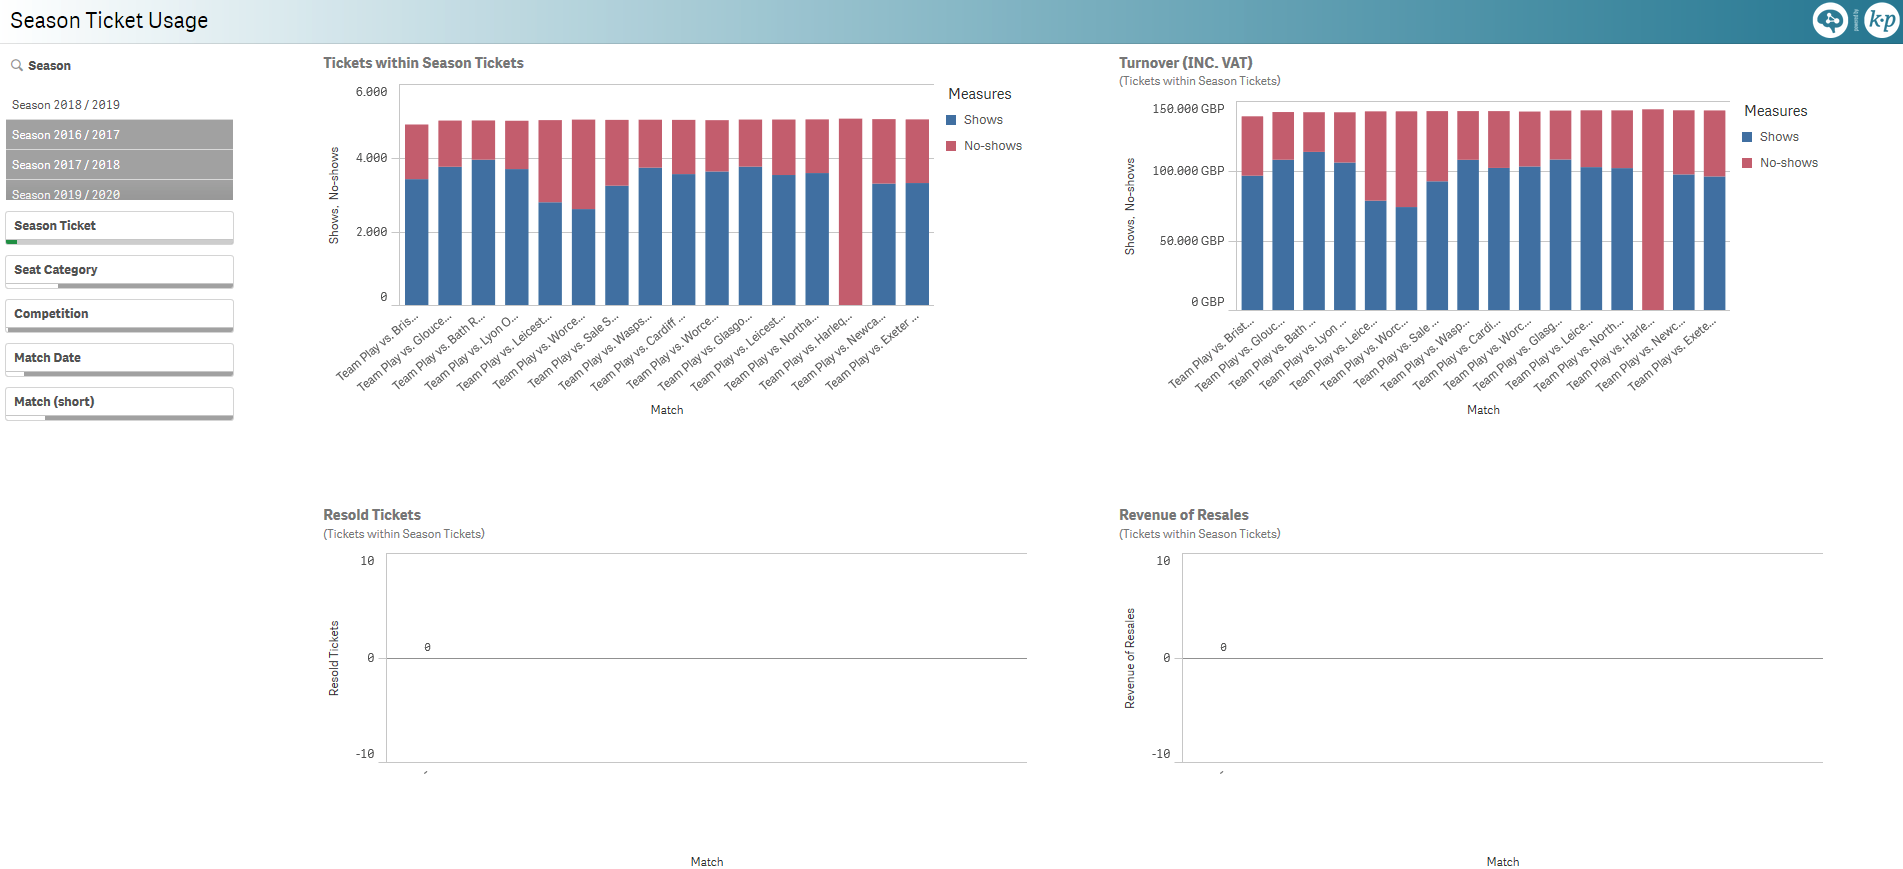
Season Ticket Usage [SP]
Number of tickets within a season ticket and their revenue utilization, i.e., shows/no-shows, per match.
Number of tickets resold within a season ticket and their resales revenue per match.
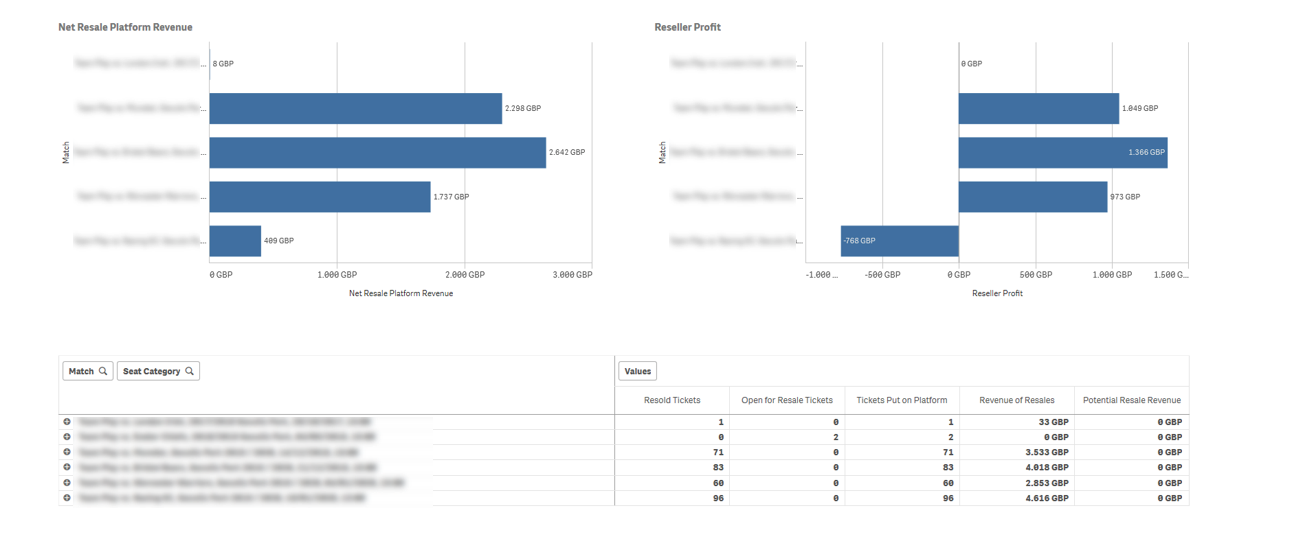
Ticket Resales [SP]
KPI for resales:
- Number of match with resales
- Number of tickets resold
- Revenue of resales
- Number of tickets open for resales
- Potential revenue of resales
Ticket resales and revenue of resales distributed per match and split between resold and open for resales.
Net resale platform revenue and reseller profit per match.
Pivot table for the matches and seat categories and the following measures:
- Number of tickets resold
- Number of tickets open for resales
- Total number of resales tickets
- Revenue of resales
- Potential revenue of resales
Contact cross-distribution [SP]
Number of customers, sold tickets and revenue
| distributed per | and split by |
|---|---|
|
|
Pivot table for the selected dimensions and the following measures:
- Number of customers
- Number of sold tickets
- Revenue
- Revenue per ticket
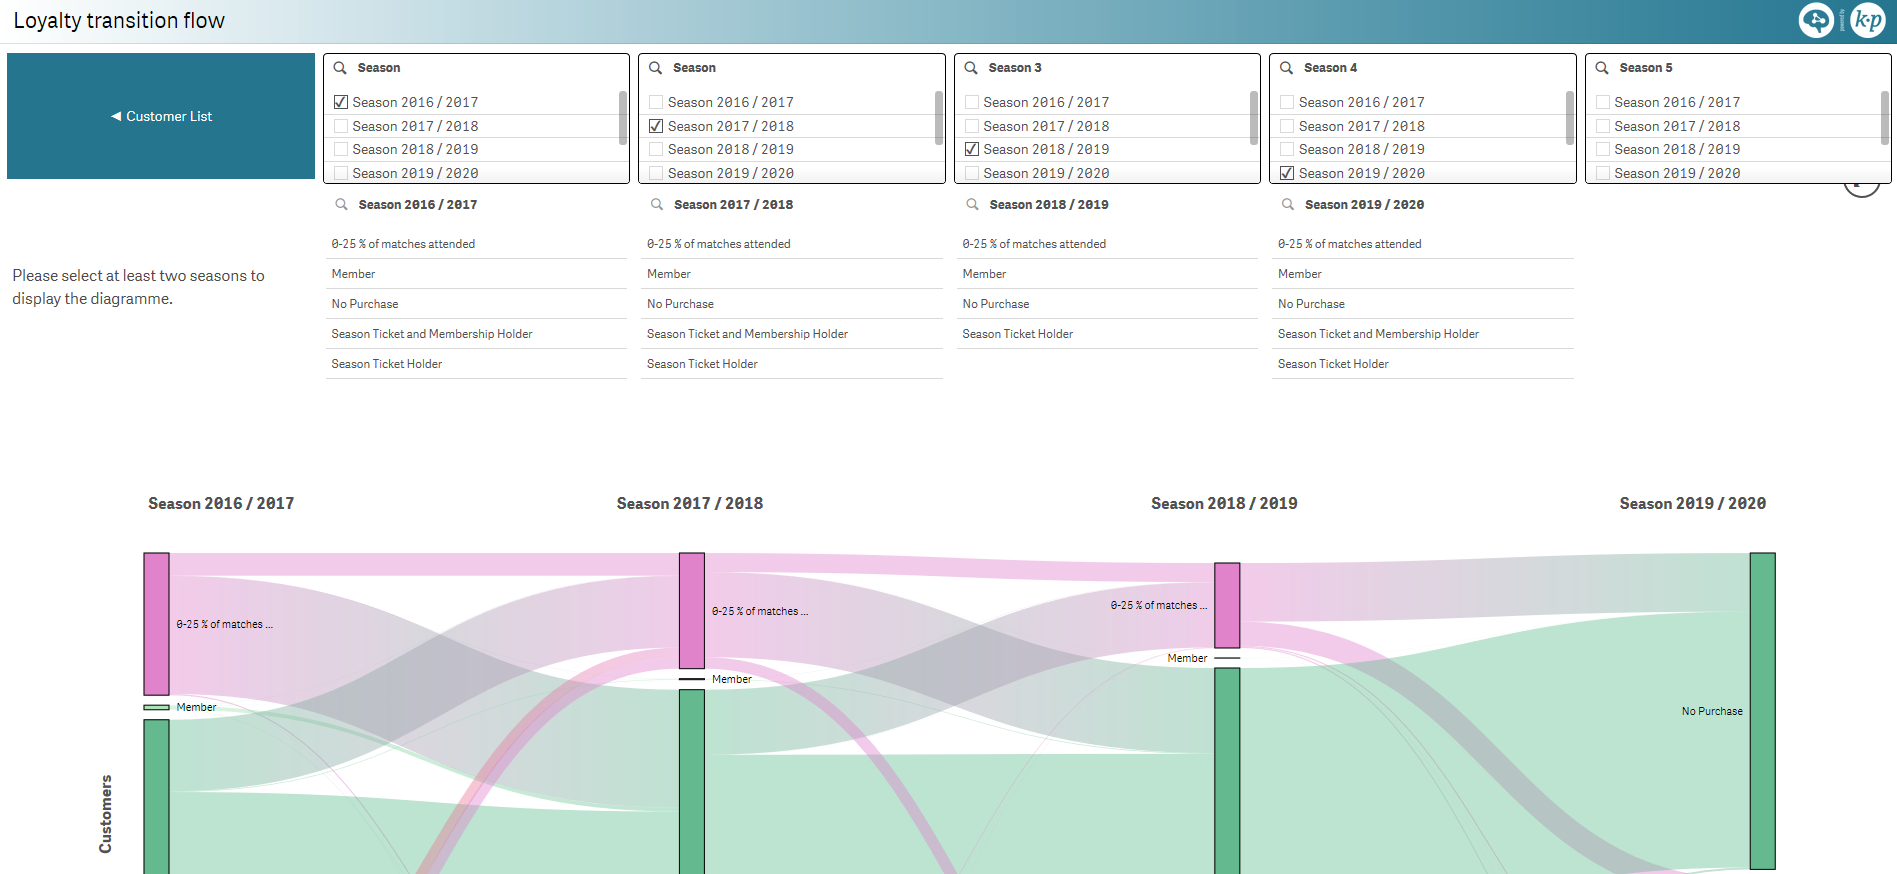
Loyalty transition flow [SP]
Customer loyalty flow between seasons split between:
- Members
- Season ticket holders
- Single ticket purchasers:
- 0-25% of all matches
- 25-50% of all matches
- 50-75% of all matches
- 75-100% of all matches
- No purchase that season
Flow data table for two seasons.
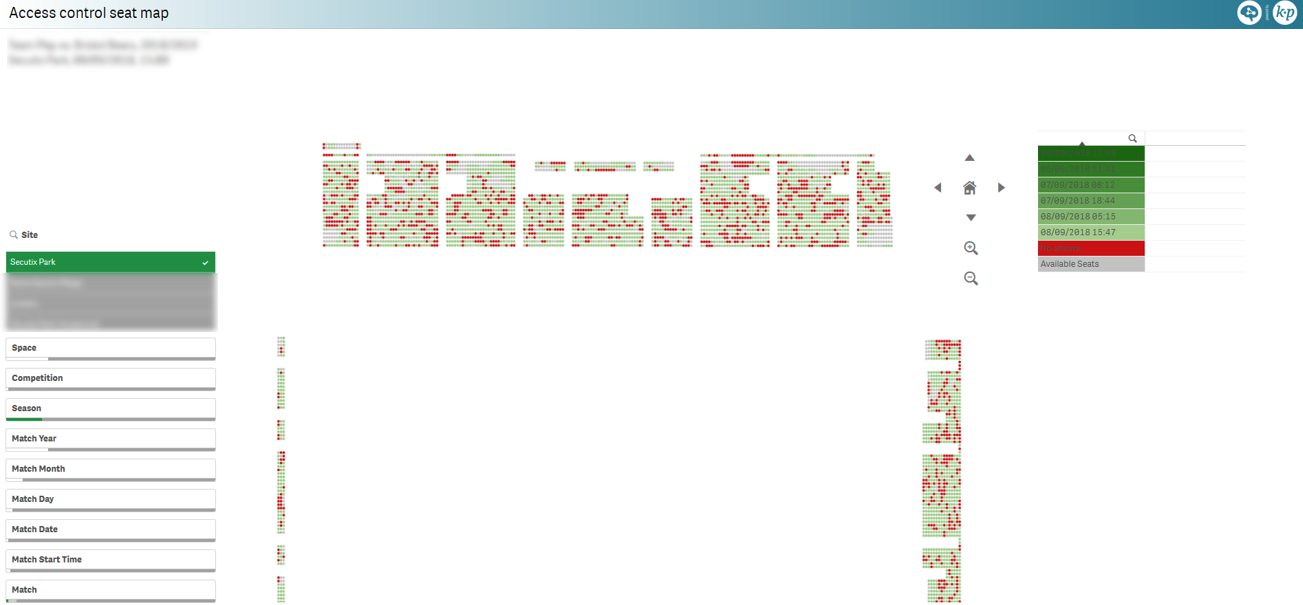
Access control seat map [SP]
Seat map view of the access control scans for a given match, color coded by:
- Time of scan
- No-shows
- Available seats
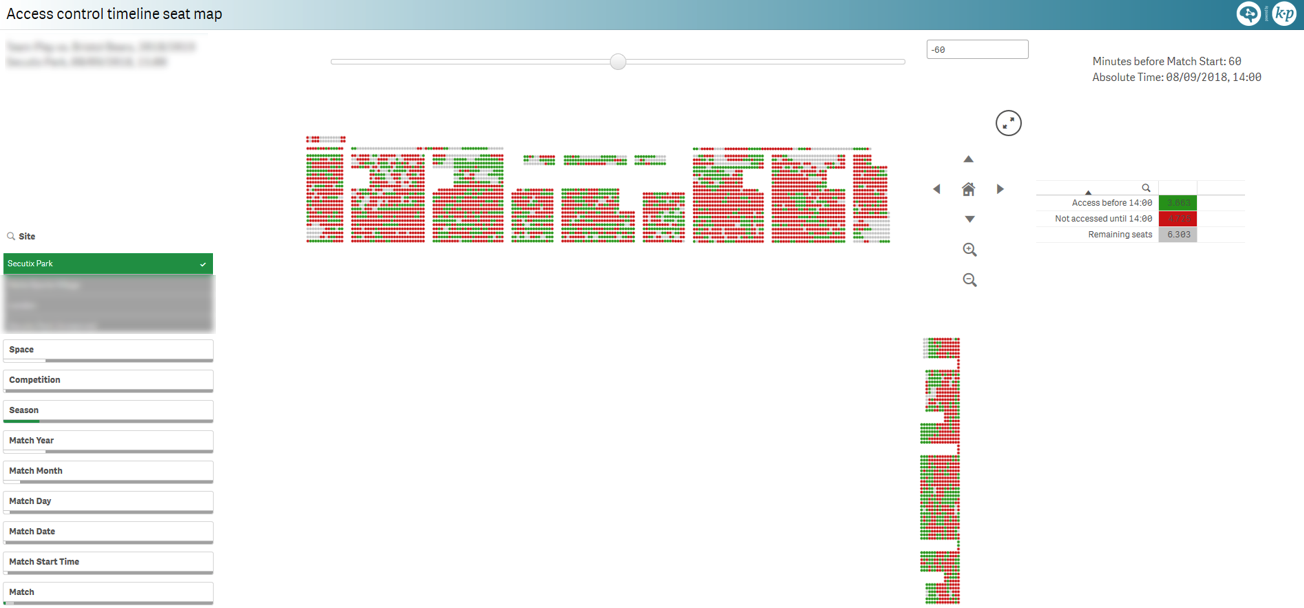
Access control timeline seat map [SP]
Seat map view of the access control for a given match and a given point in time, color coded by:
- Controlled before that time
- Not controlled at that time yet (includes no-shows)
- Remaining seats
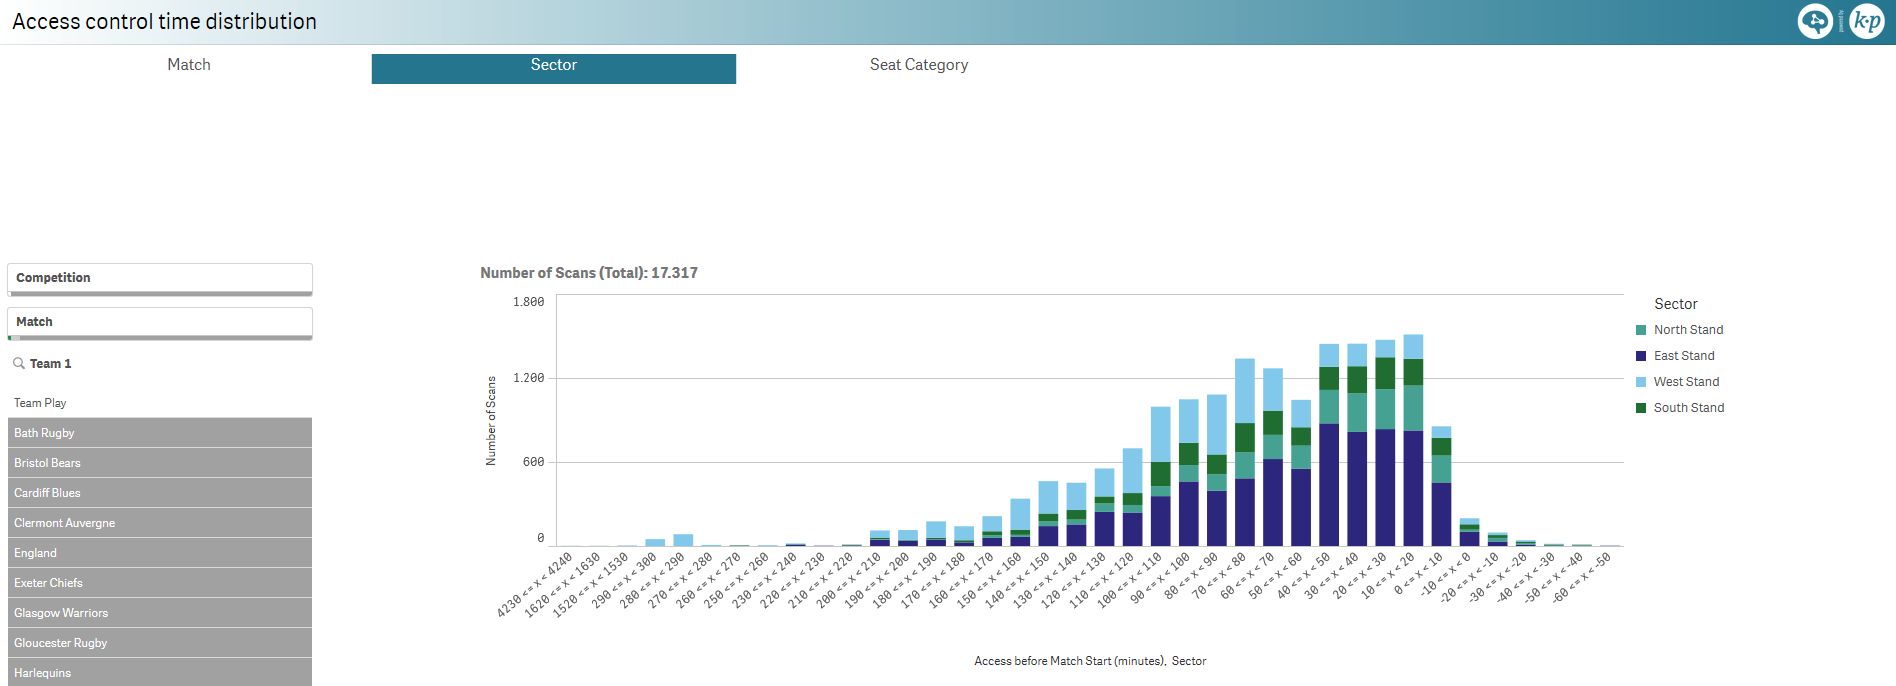
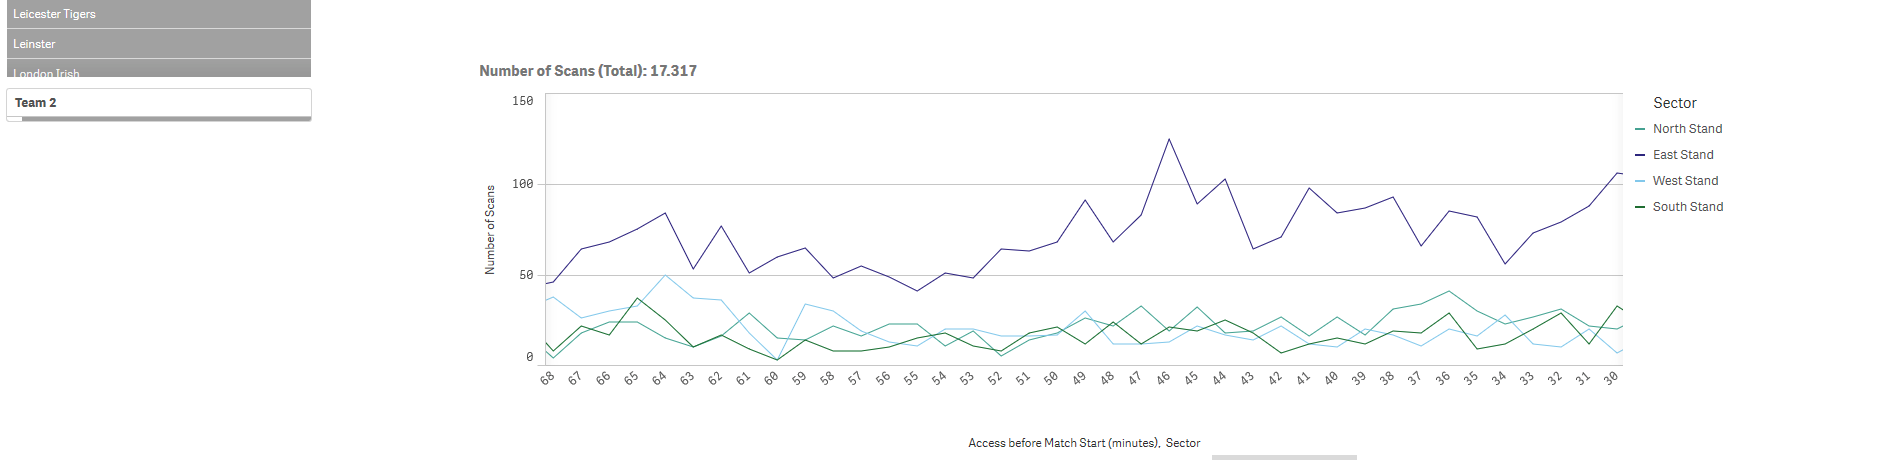
Access control time distribution [SP]
Number of access control scans per 10 minute slots, split by either:
- Match
- Sector (area)
- Seat category
Timeline of the access control scans, split over the selected category.
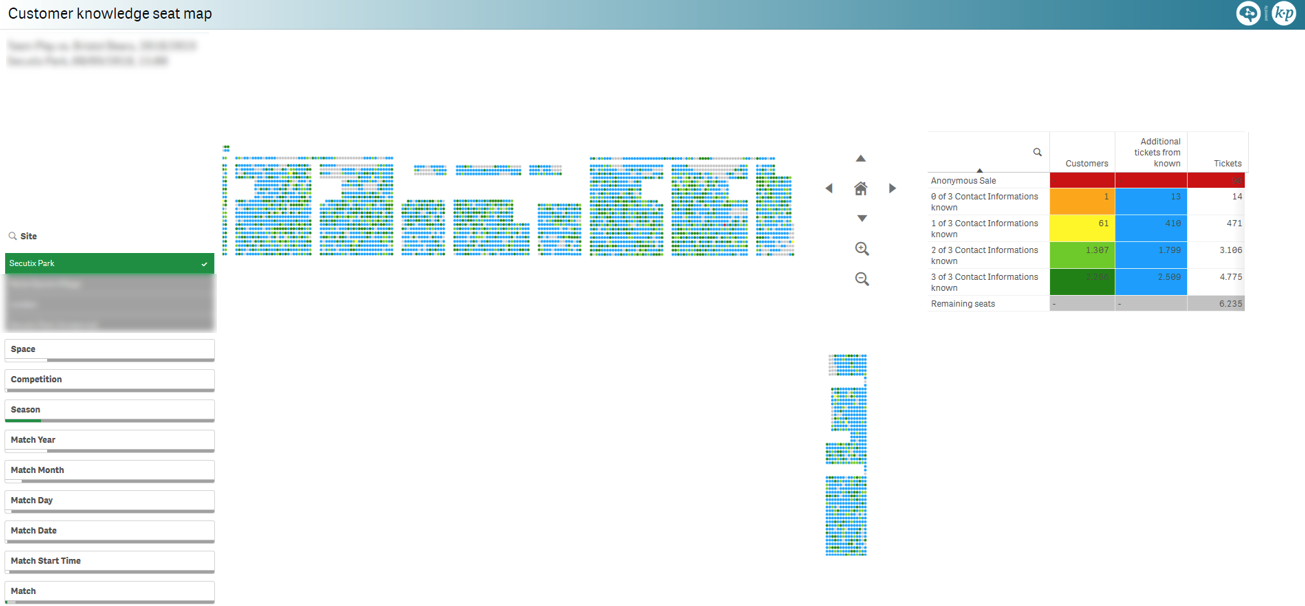
Customer knowledge seat map [SP]
Seat map view of the customer knowledge, i.e., how well you know your customers, for a given match, color coded by:
- Number of key contact info that are known:
- Email address
- Phone number
- Postal address
- Additional tickets of known customers
- Anonymous sales
- Remaining seats
Competition Utilization [SP]
Scatter plot of matches and competitions for the following sets of dimensions:
- number of sold tickets versus seating capacity
- revenue and target revenue
Note: target revenues can be defined in the catalogue module of SecuTix, see here for more details.
Seat cat./contingent utilization matrix [SP]
Pivot table by competition and match date for the following measures, split over seat category and contingent:
| Tickets | Revenue |
|---|---|
|
|
Calendar view [SP]
Match date and purchase date calendar view, with coloring sliders, for the following dimensions:
- Number of matches
- Number of sold tickets
- Revenue
- Capacity utilization
- Financial utilization
- Revenue per seat
Consumer behaviour 1 [SP]
Customers and total contacts, which also includes contacts with cancellations, distributed per:
- Distance to institution
- Average price per ticket
- Number of customers per competition
Consumer behaviour 2 [SP]
Customers and total contacts, which also includes contacts with cancellations, distributed per:
- Purchase date relative to the match date
- Number of attendances per contact
- Number of customers per quarter of year