This page presents the full list of DAN reports. Depending on the activated verticals, only a sub-set of reports may be available.
All verticals
Latest revenue distribution
Package Sales
Membership Sales
Service Sales
Voucher Sales
Donation Sales
Goods Sales
Open Product Sales
Revenue utilization per product
Contact filters
Contact list
Catchment area
Contact purchase details
Geoanalysis
Season ticket transition flow*
(*) Not available in the Museums vertical
Live Entertainment and festivals
Upcoming performances KPI
Key Performance Indicators (KPI) for the upcoming performances, i.e., based on the performance date:
- number of performances
- total capacity
- number of tickets sold
- number of reservations
- total revenue
- revenue per ticket
- average discount per ticket
Pivot table with the additional measures:
- total tickets (sold + reserved)
- attendance percentage
- max revenue
- revenue per seat
Latest sales KPI
Key Performance Indicators (KPI) for the recent sales, i.e., based on the sales date:
Latest performances
Latest events
Event KPI
Event weekday/month distribution
Event utilization
Latest sales per audience category
Latest sales per performance
Calendar view
Year/season comparison
Utilization per month
Seat cat./contingent utilization matrix
Sales potential per performance/seat cat.
Configuration seat map
Sales timeline seat map
Venue utilization
Seasonal utilization
Event life cycle
After event premiere
Sales period
Sales categorization relative to performance date
Sales comparison relative to performance date
Sales cross-distribution
Season ticket sales
Season ticket sales per event/performance
Season ticket sales date distribution
Consumer behaviour 1 (Live Entertainment)
Consumer behaviour 2 (Live Entertainment)
Contact cross-distribution
Ticket Resales
Museums
Latest attendance/sales KPI
Latest sales per date
Ticket sales year comparison
Revenue year comparison
Attendance history
Attendance time/weekday/month distribution
Group attendance cross-distribution
Individuals attendance cross-distribution
Attendance year comparison
Attendance distribution per price type
Guided visits distribution
Visitor flow
Latest group attendance
Upcoming group attendance
Latest individuals attendance
Upcoming individuals attendance
Attendance and revenue per time of day
Attendance/sales cross-distribution
Visit revenue/visitor plot
Timeslot schedule by date/month/weekday
Consumer behaviour
Contact cross-distribution
Sports club and stadiums
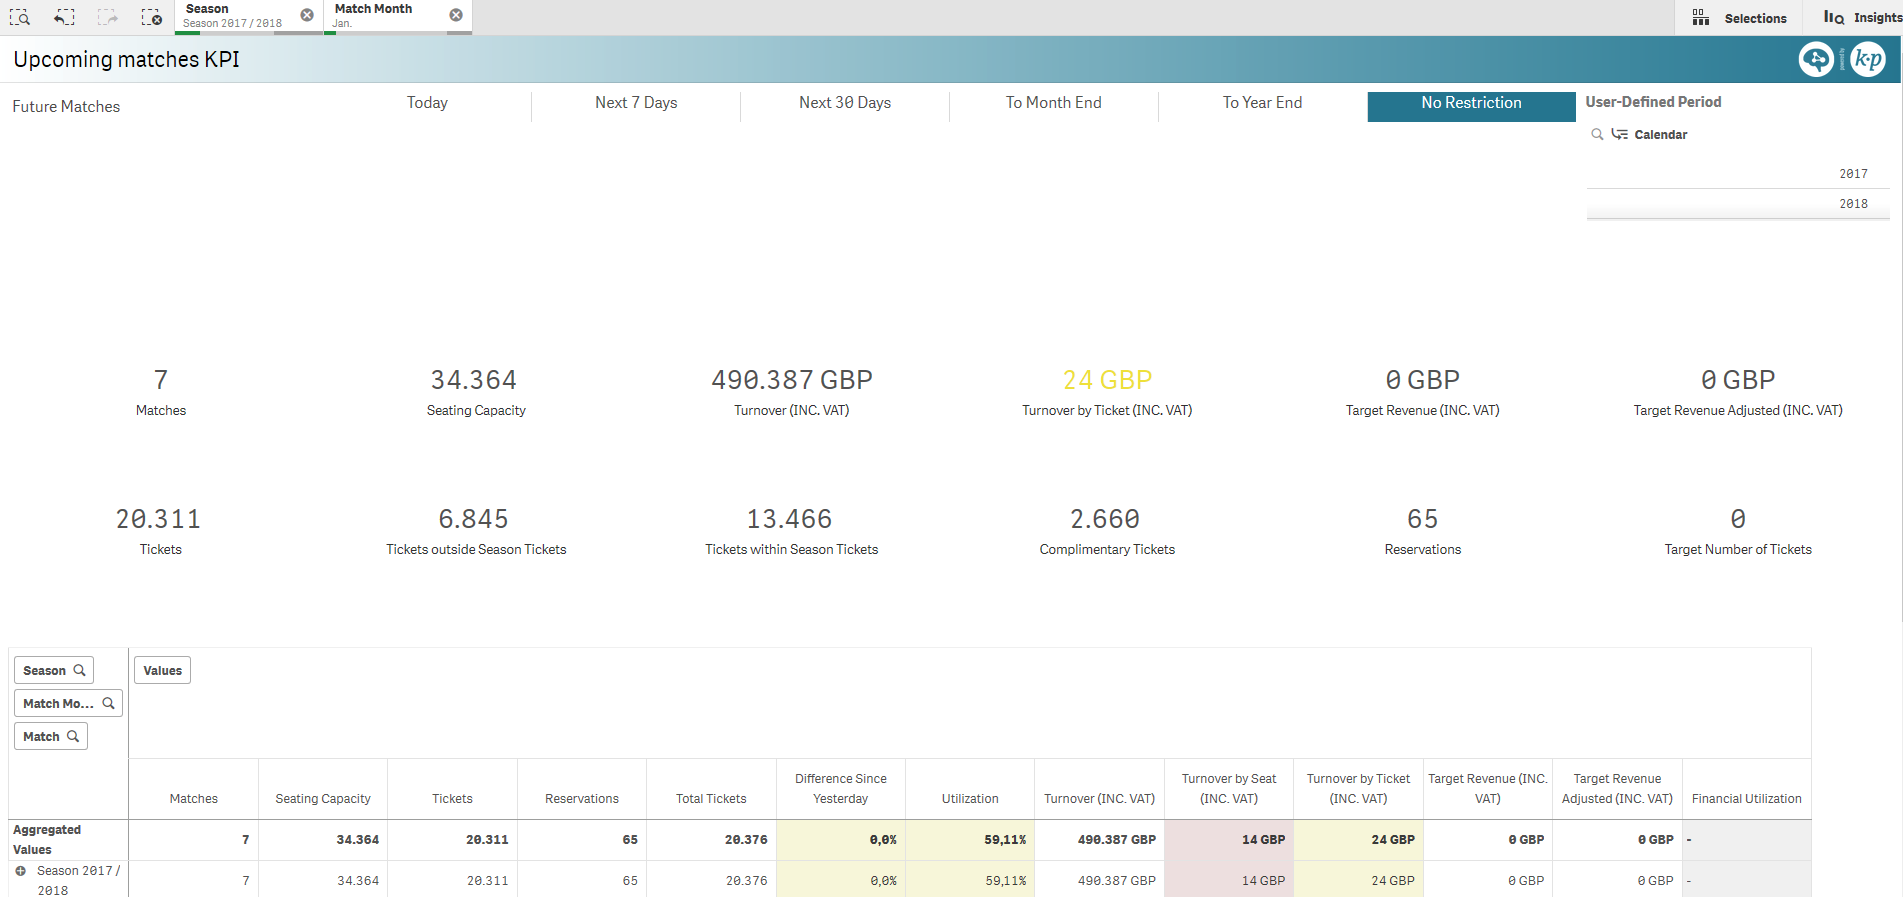
Upcoming matches KPI
Key Performance Indicators (KPI) for the upcoming matches.
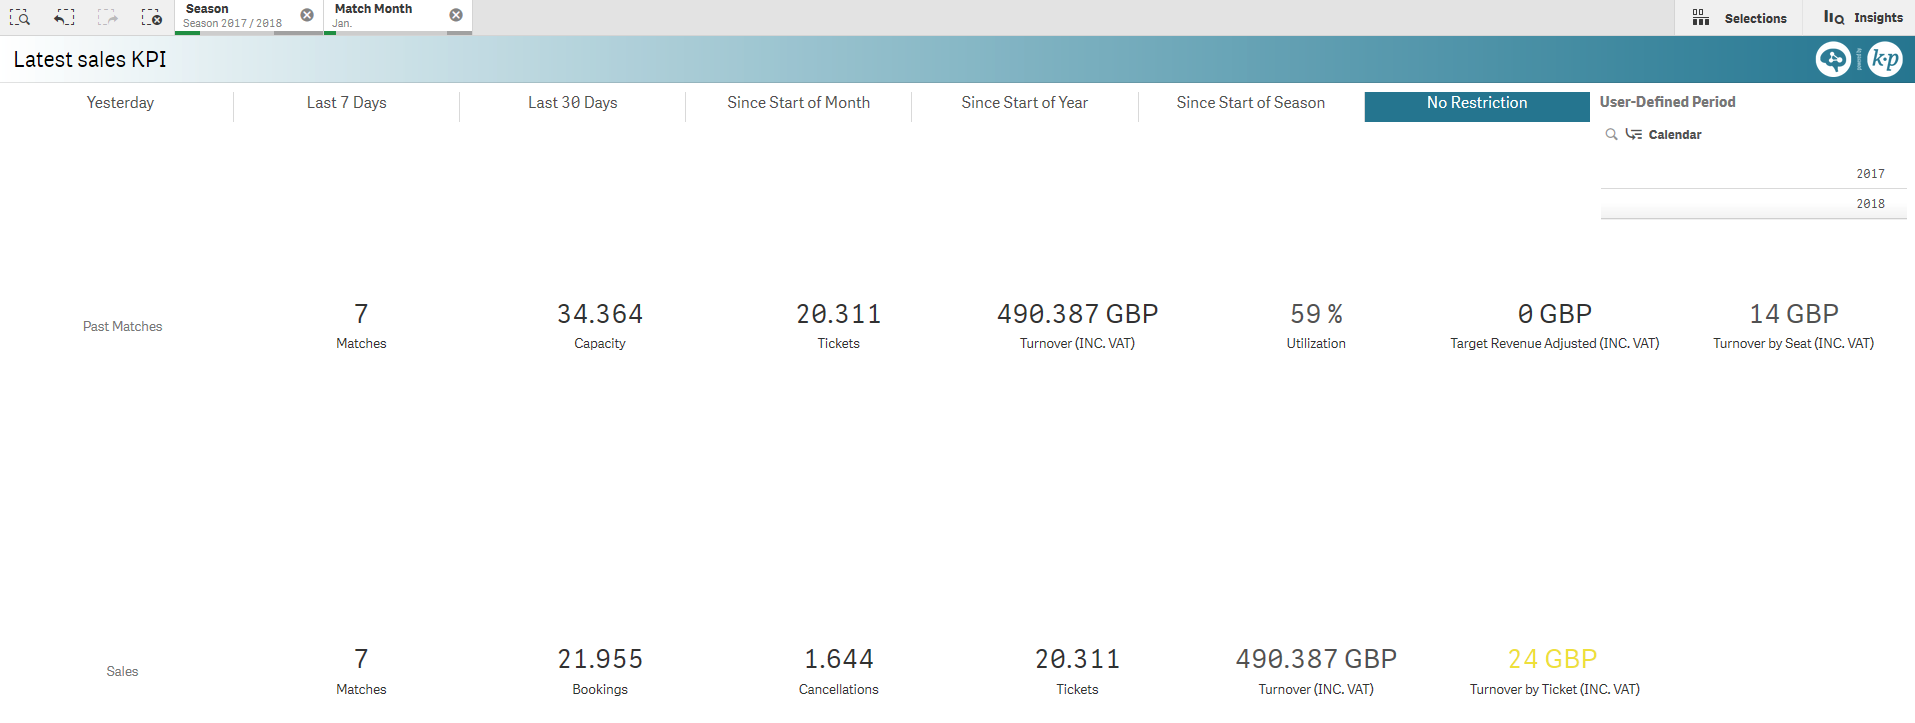
Latest sales KPI
KPI for the latest sales, i.e, based on the sales date.
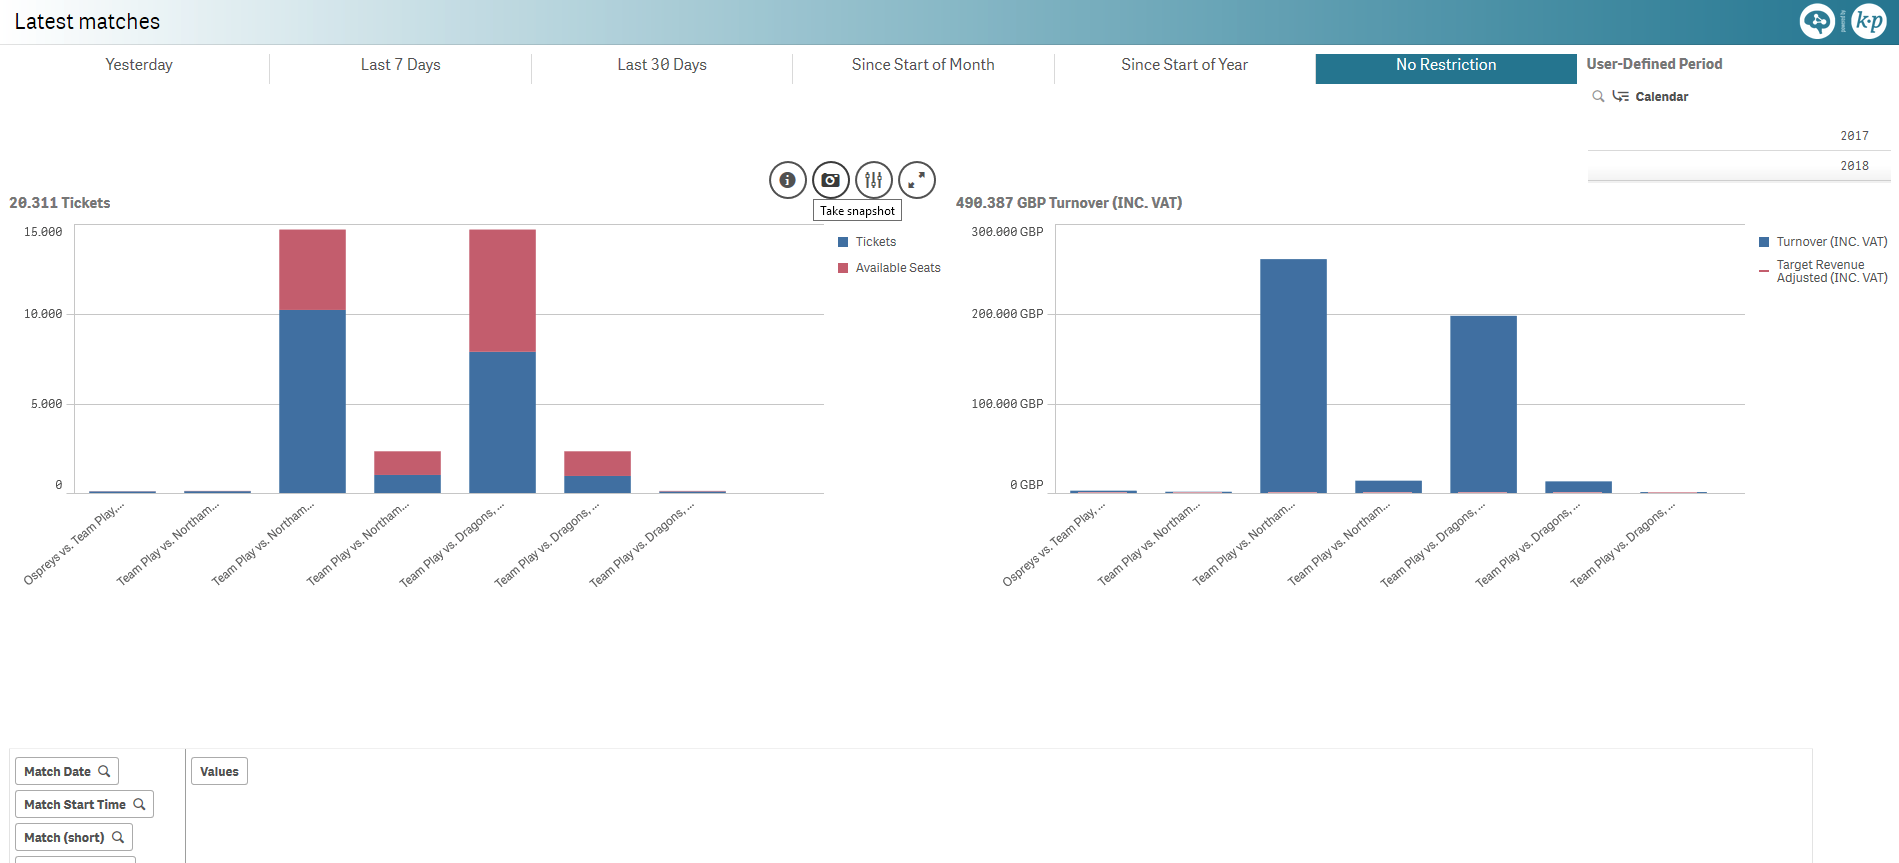
Latest matches
Ticket and revenue charts for the latest matches with respect to the full quota and target revenue respectively.
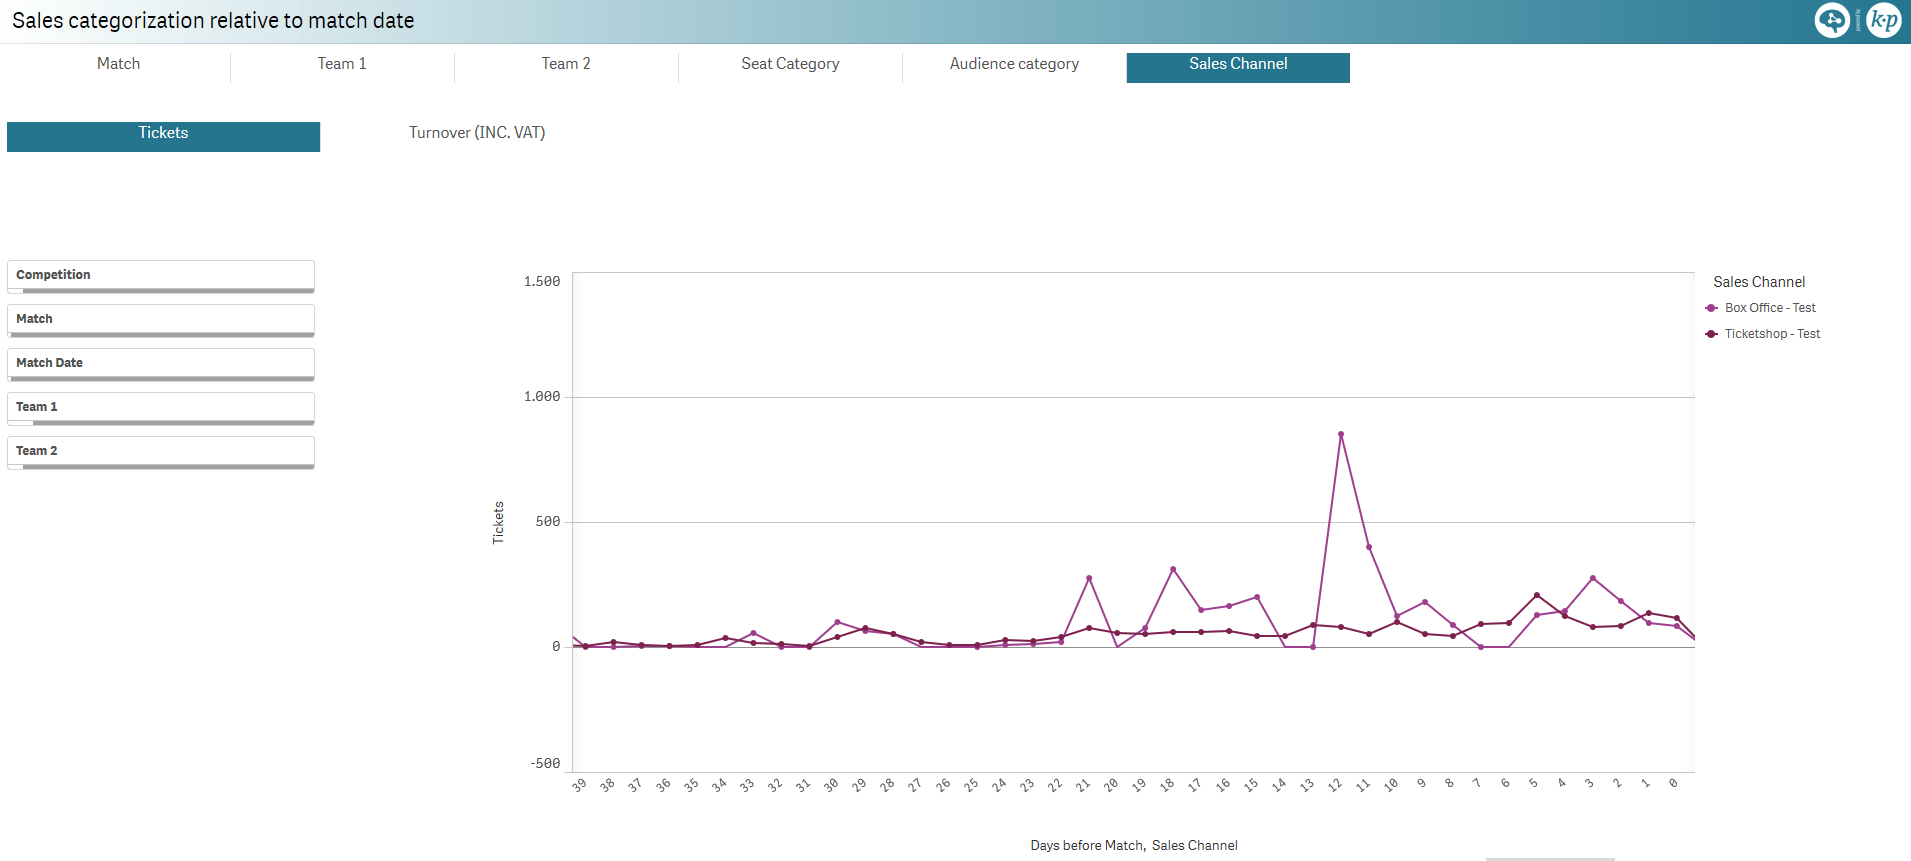
Sales categorization relative to match date
Comparing ticket sales or revenue with respect to match date for the following dimensions:
Match
Team 1
Team 2
Seat category
Audience category
Sales channel
Includes team logo display
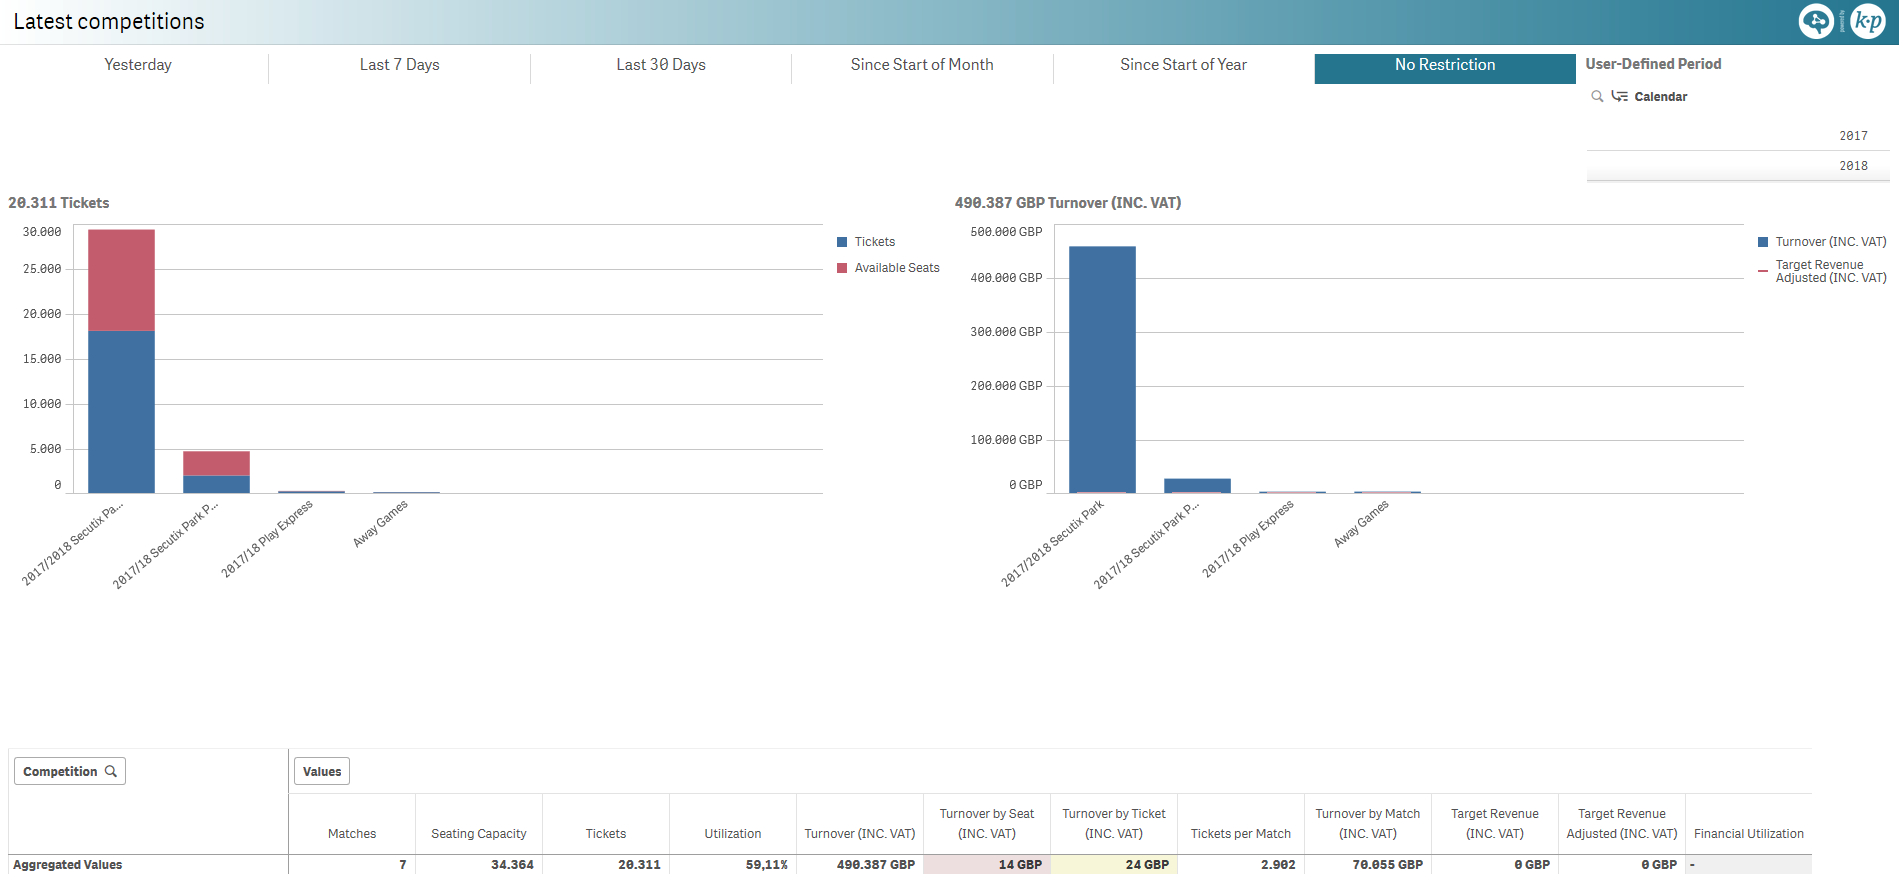
Latest competitions
Ticket and revenue charts for the latest competitions with respect to the full quota and target revenue respectively.
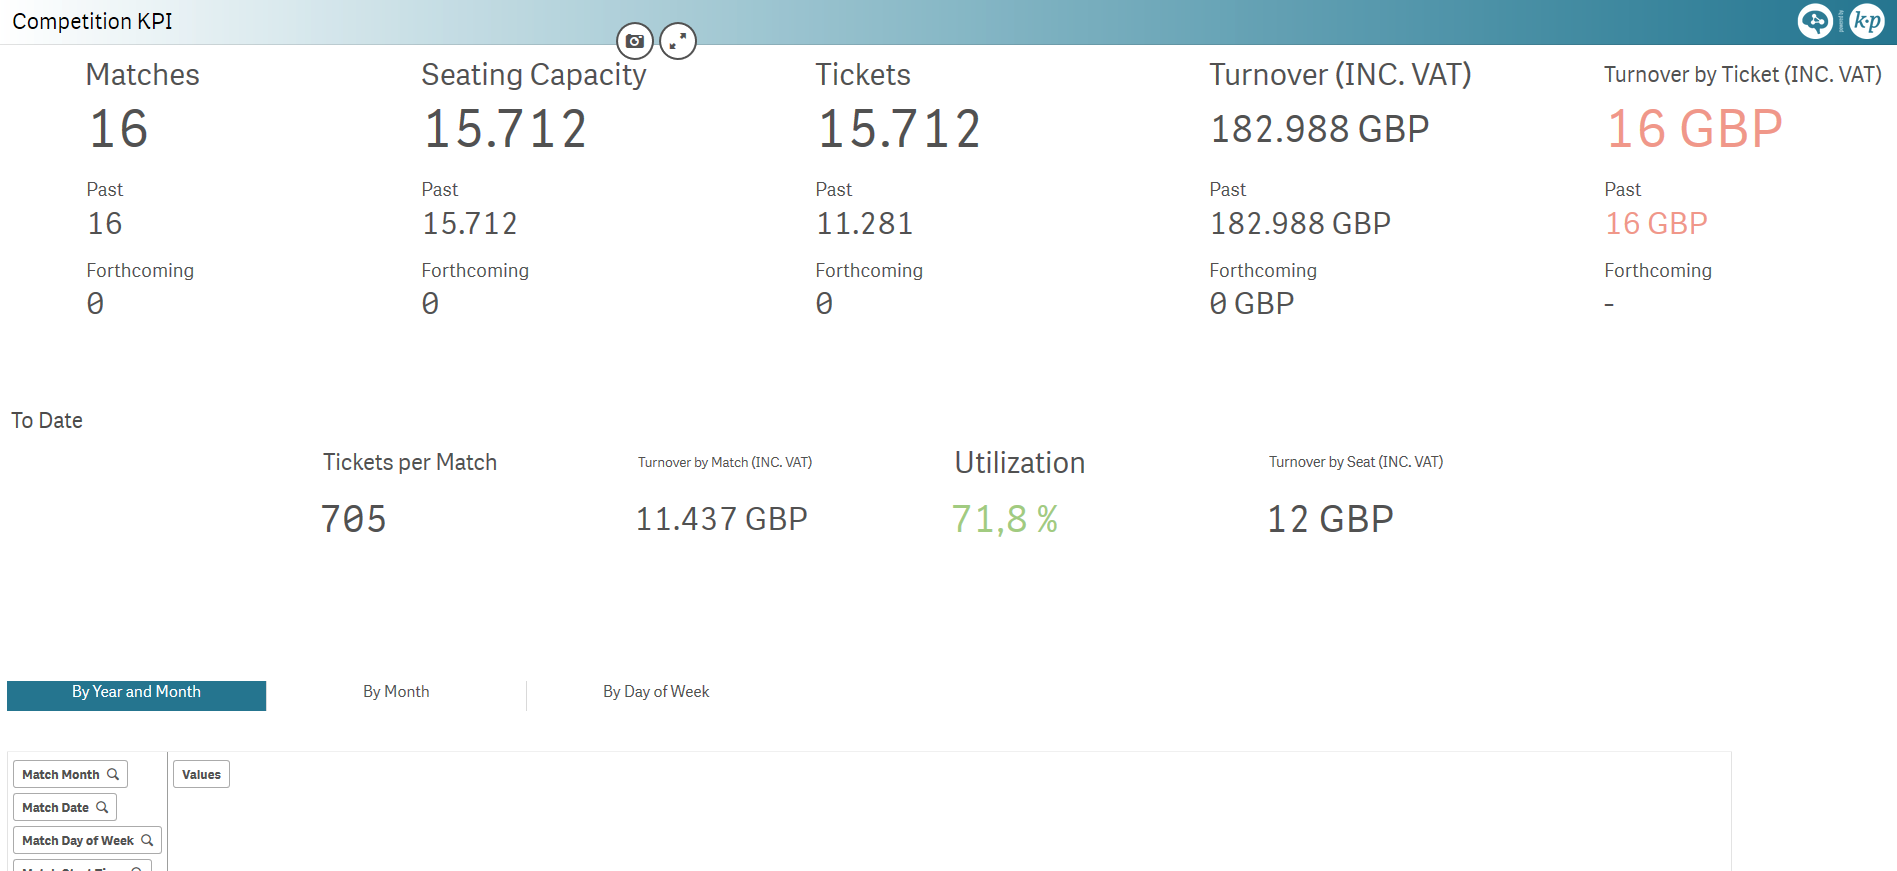
Competition KPI
KPI for an ongoing competition, with a split on past and forthcoming matches:
Number of matches
Seating capacity
Number of tickets sold
Turnover
Turnover per ticket
and a view on the sales to date for the entire competition:
Tickets per match
Revenue per match
Seat capacity utilization
Revenue per seat
Note: Best for a selected competition
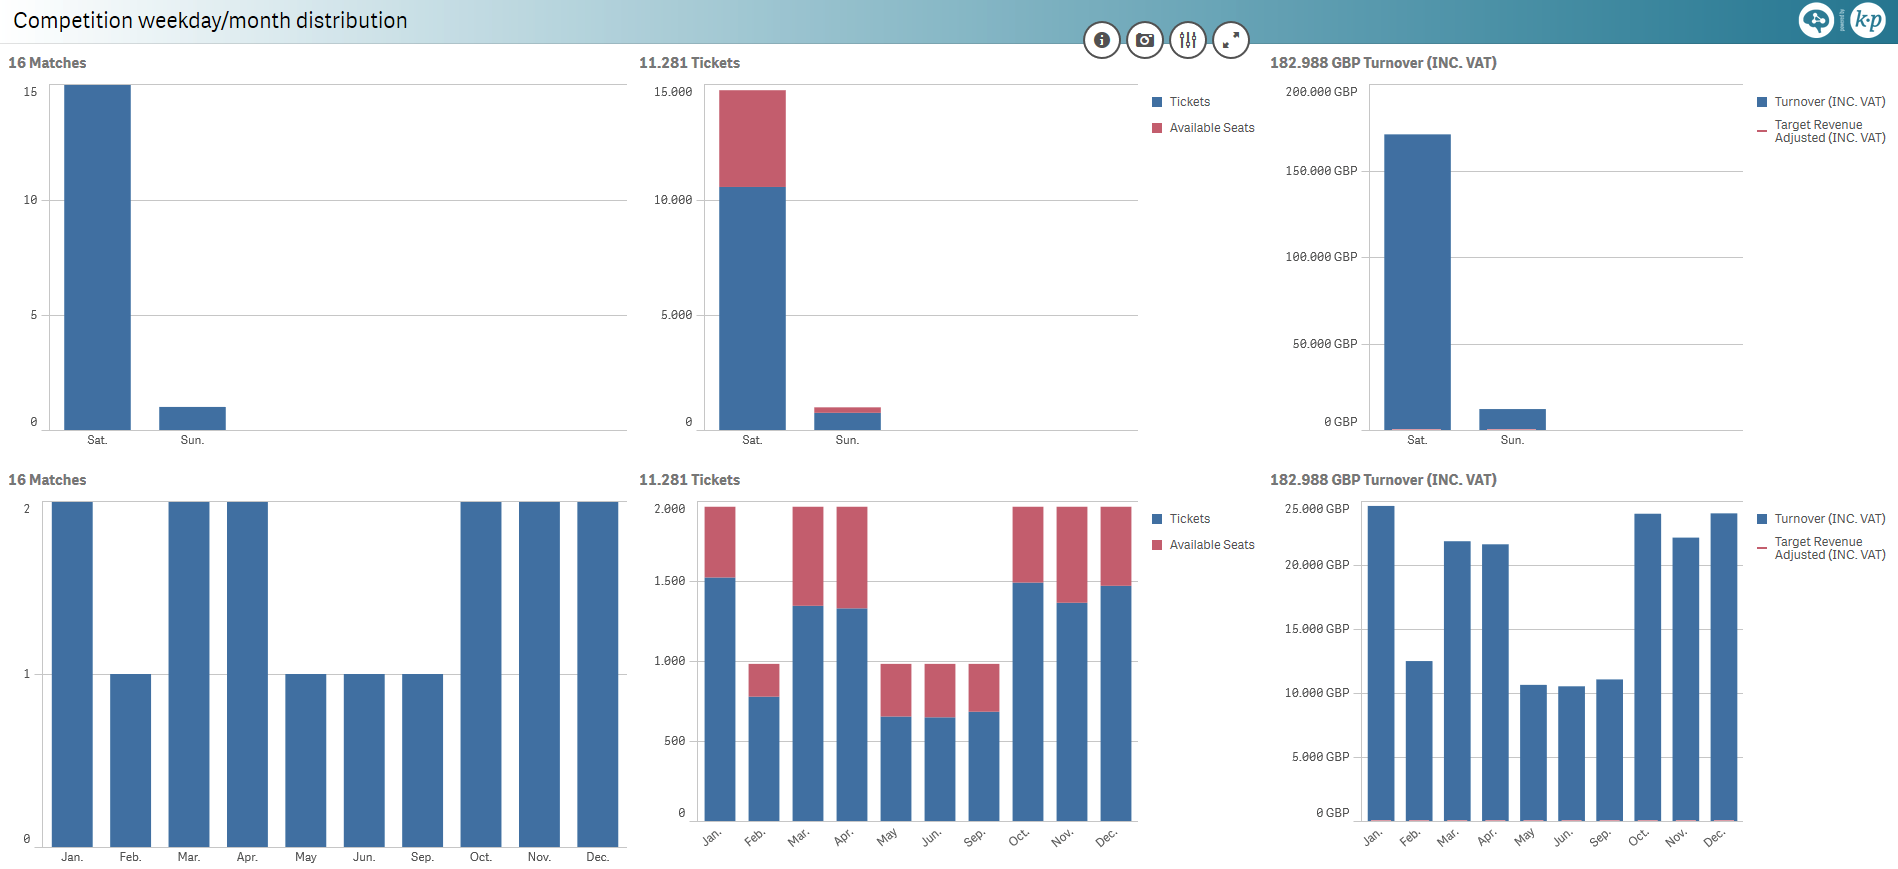
Competition weekday/month distribution
Number of matches, sold tickets and revenue charts distributed over:
days of the week
months
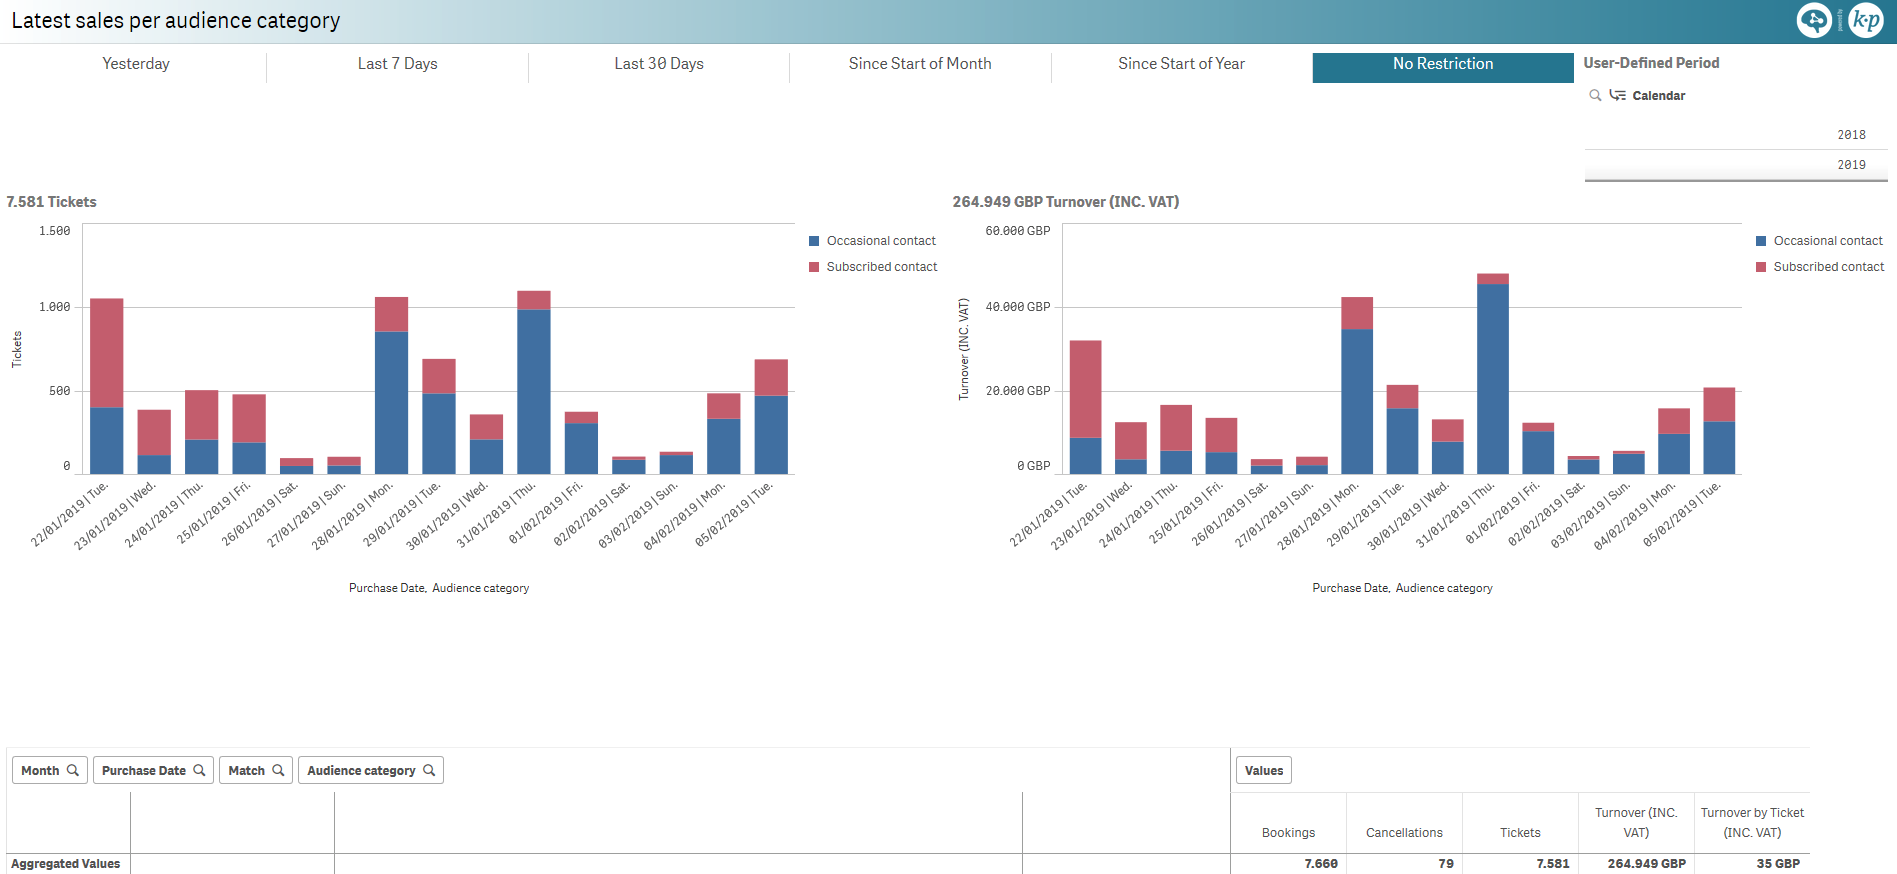
Latest sales per audience category
Latest ticket sales and revenue per sales date, split by audience category.
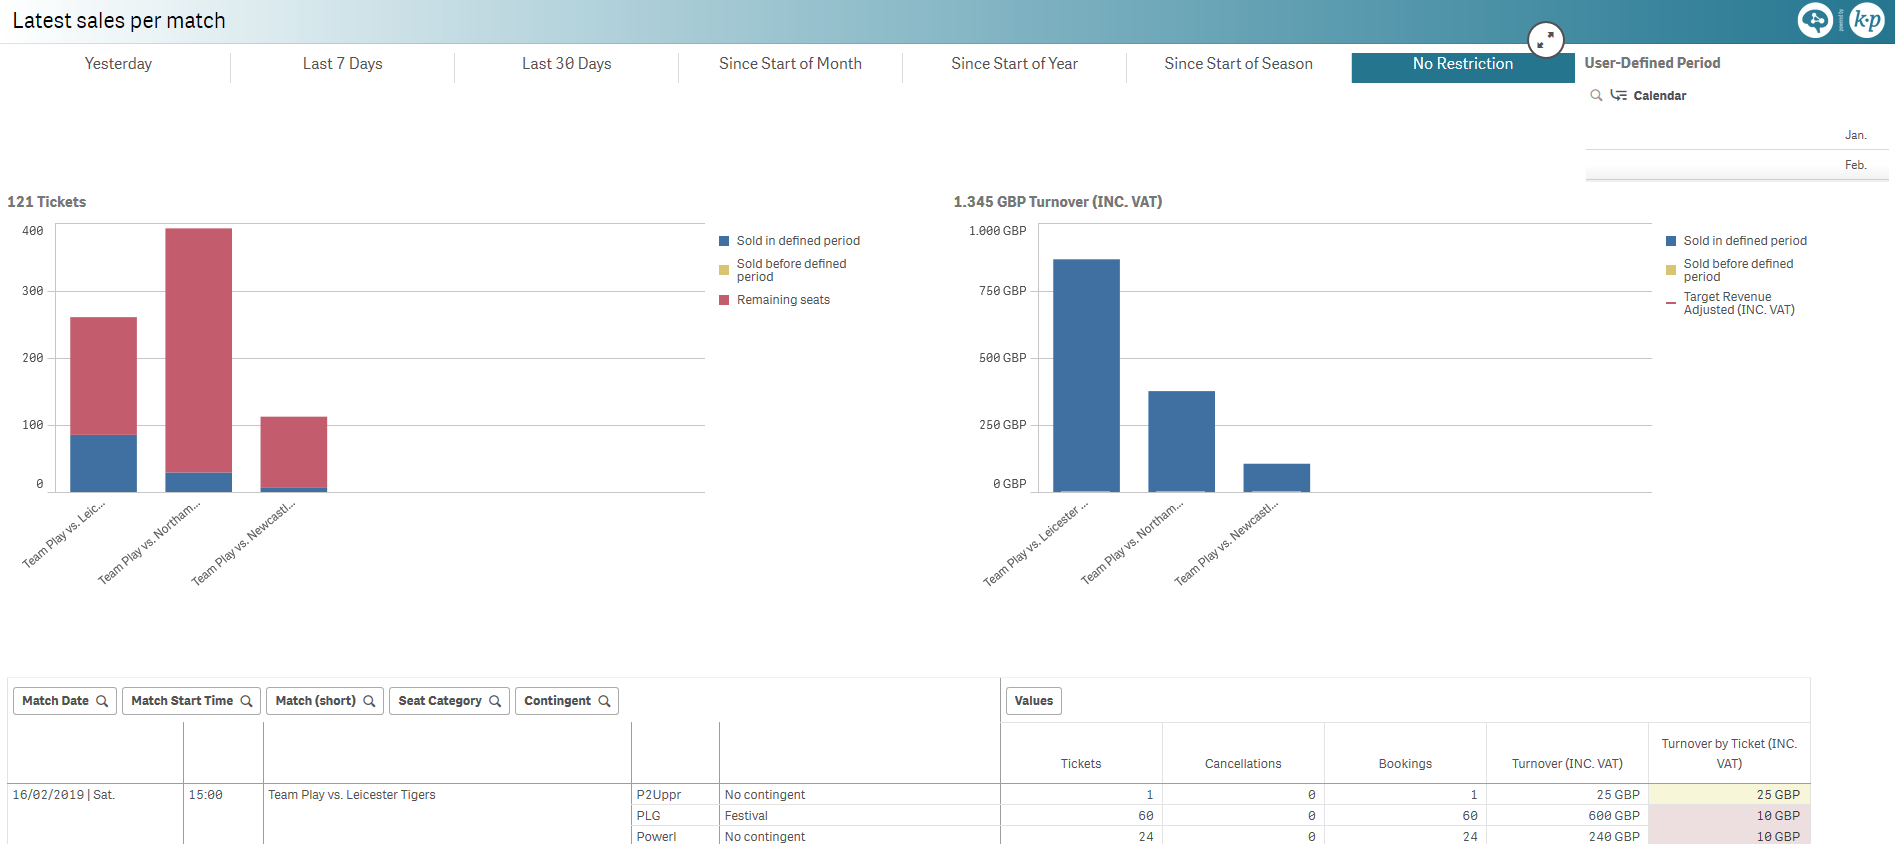
Latest sales per match
Ticket sales and revenue per match, split between latest sales and prior sales.
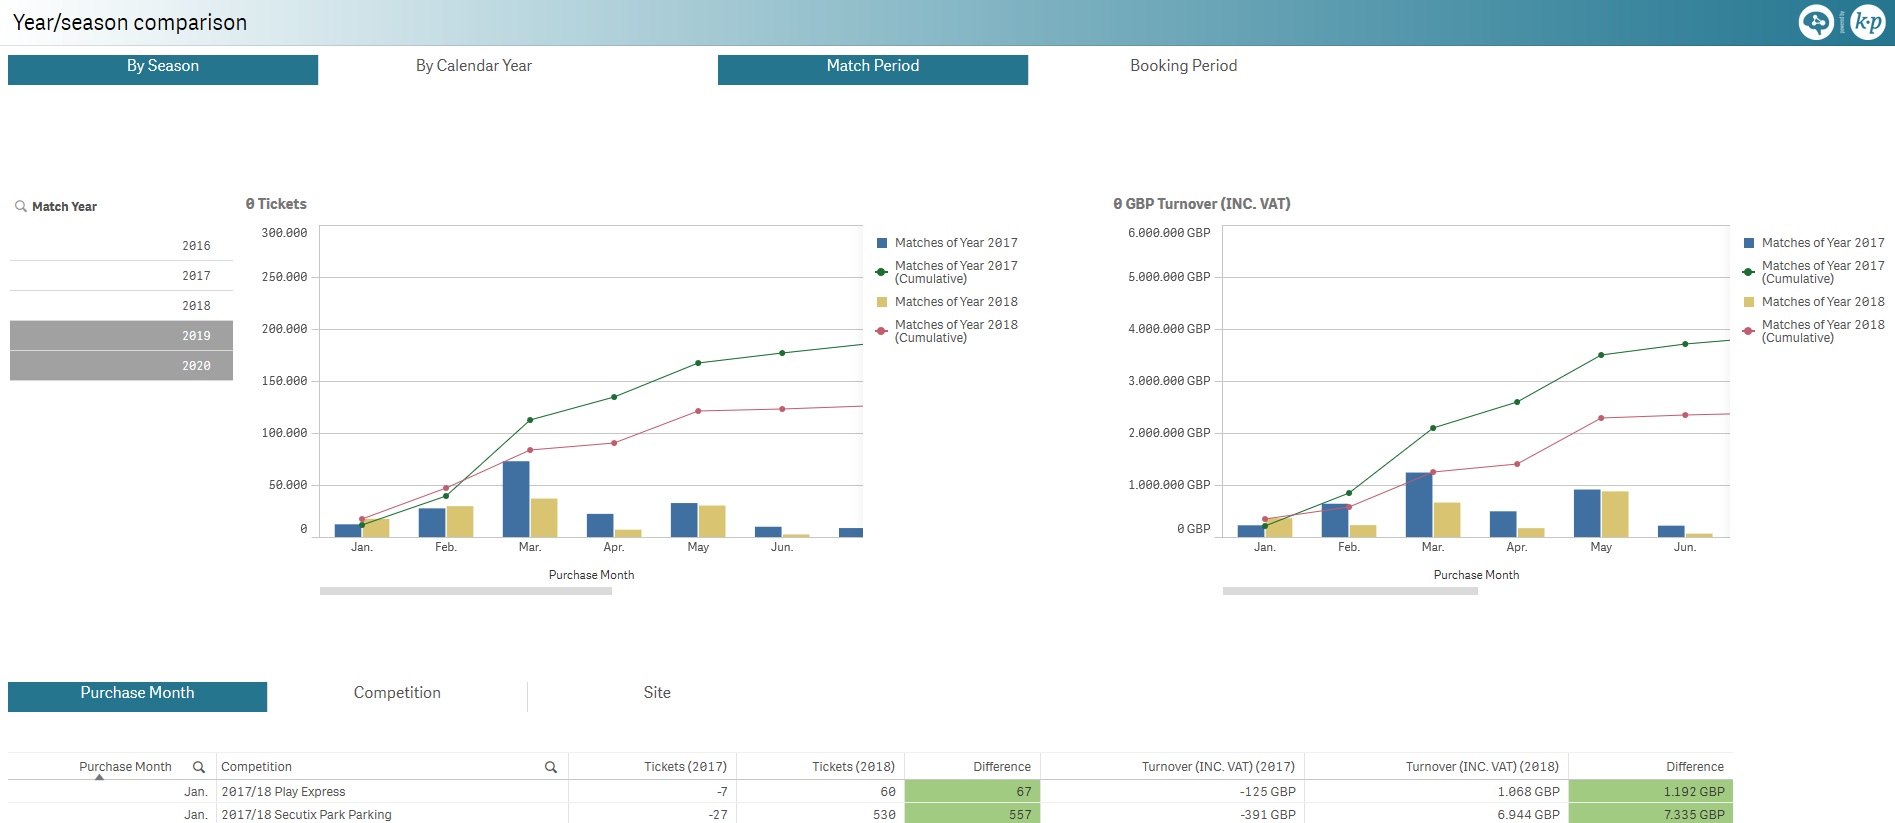
Year/season comparison
Ticket sales and revenue monthly comparison over two seasons or years, including cumulative numbers.
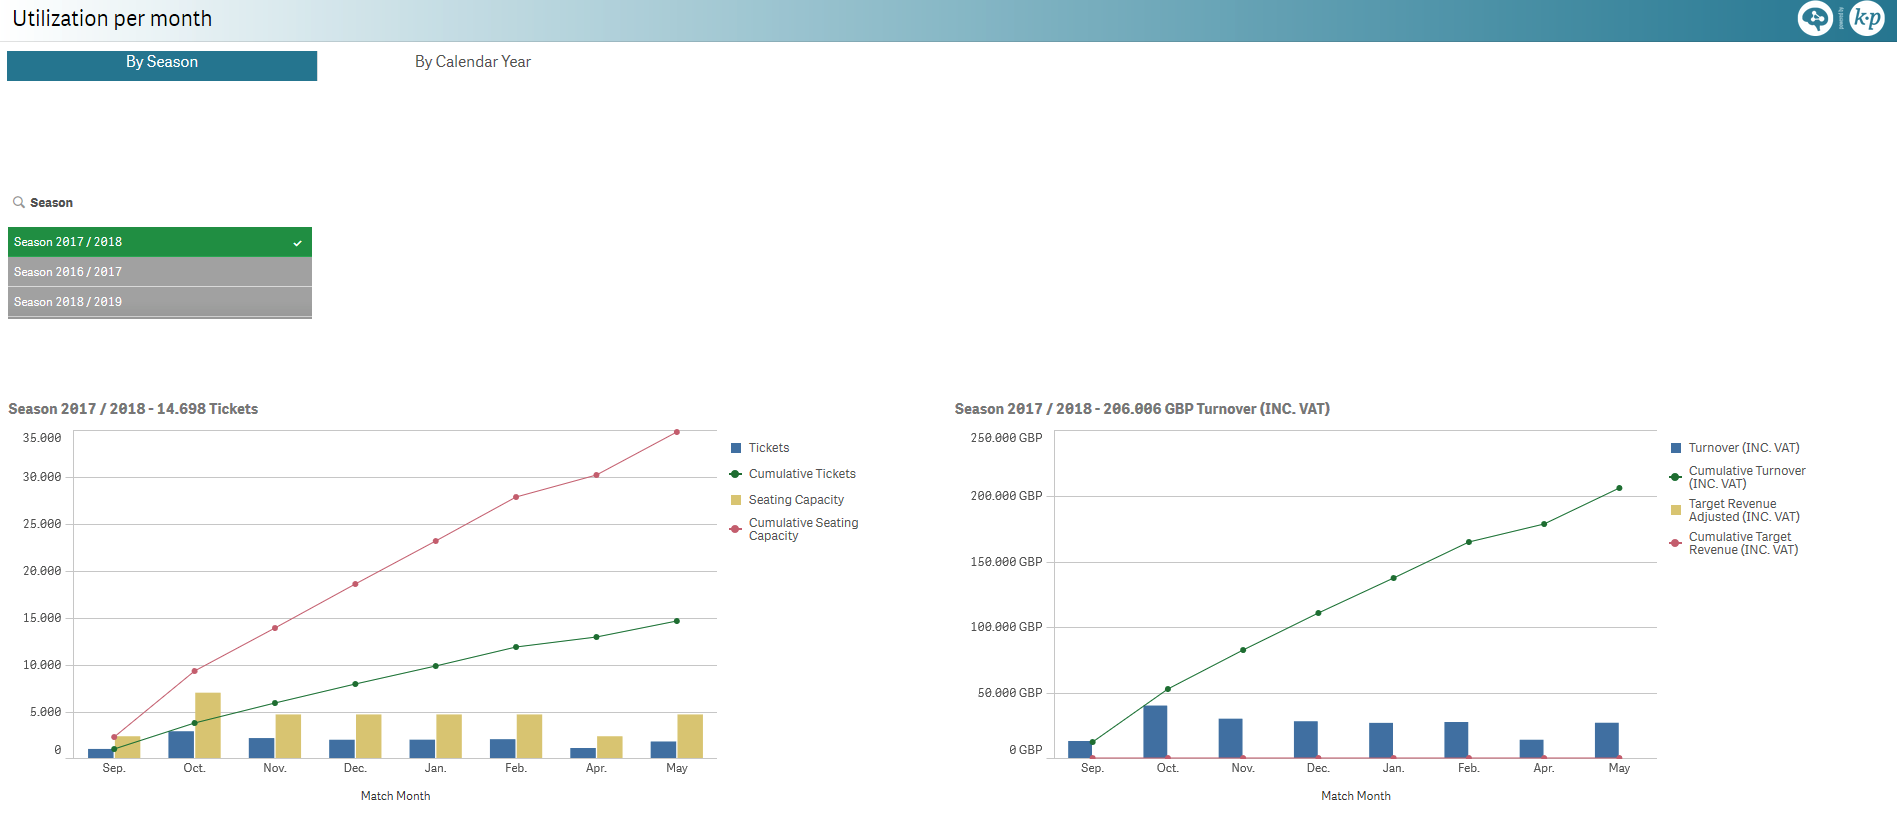
Utilization per month
Ticket sales and revenue monthly comparison with respect to the full quota and target revenue respectively.