This page presents the full list of DAN reports. Depending on the activated verticals, only a sub-set of reports may be available.
All verticals
| Title | Description |
|---|---|
| Latest revenue distribution | |
| Package Sales | |
| Membership Sales | |
| Service Sales | |
| Voucher Sales | |
| Donation Sales | |
| Goods Sales | |
| Open Product Sales | |
| Revenue utilization per product | |
| Contact filters | |
| Contact list | |
| Catchment area | |
| Contact purchase details | |
| CRM Flexi Pivot Table | |
| Geoanalysis | |
| Season ticket transition flow* |
(*) Not available in the Museums vertical
Live Entertainment and festivals
| Title | Description |
|---|---|
| Upcoming performances KPI | Key Performance Indicators (KPI) for the upcoming performances, i.e., based on the performance date:
Pivot table with the additional measures:
|
| Latest sales KPI | Key Performance Indicators (KPI) for the recent sales, i.e., based on the sales date: |
| Latest performances | |
| Latest events | |
| Event KPI | |
| Event weekday/month distribution | |
| Event utilization | |
| Latest sales per audience category | |
| Latest sales per performance | |
| Calendar view | |
| Year/season comparison | |
| Utilization per month | |
| Seat cat./contingent utilization matrix | |
| Sales potential per performance/seat cat. | |
| Configuration seat map | |
| Sales timeline seat map | |
| Venue utilization | |
| Seasonal utilization | |
| Event life cycle | |
| After event premiere | |
| Sales period | |
| Sales categorization relative to performance date | |
| Sales comparison relative to performance date | |
| Sales cross-distribution | |
| Sales Flexi Pivot Table | |
| Season ticket sales | |
| Season ticket sales per event/performance | |
| Season ticket sales date distribution | |
| Consumer behaviour 1 (Live Entertainment) | |
| Consumer behaviour 2 (Live Entertainment) | |
| Contact cross-distribution | |
| Ticket Resales |
Museums
| Title | Description |
|---|---|
| Latest attendance/sales KPI | |
| Latest sales per date | |
| Ticket sales year comparison | |
| Revenue year comparison | |
| Attendance history | |
| Attendance time/weekday/month distribution | |
| Group attendance cross-distribution | |
| Individuals attendance cross-distribution | |
| Attendance year comparison | |
| Attendance distribution per price type | |
| Guided visits distribution | |
| Visitor flow | |
| Latest group attendance | |
| Upcoming group attendance | |
| Latest individuals attendance | |
| Upcoming individuals attendance | |
| Attendance and revenue per time of day | |
| Attendance/sales cross-distribution | |
| Visit revenue/visitor plot | |
| Timeslot schedule by date/month/weekday | |
| Consumer behaviour | |
| Contact cross-distribution |
Sports club and stadiums
| Title | Description | |
|---|---|---|
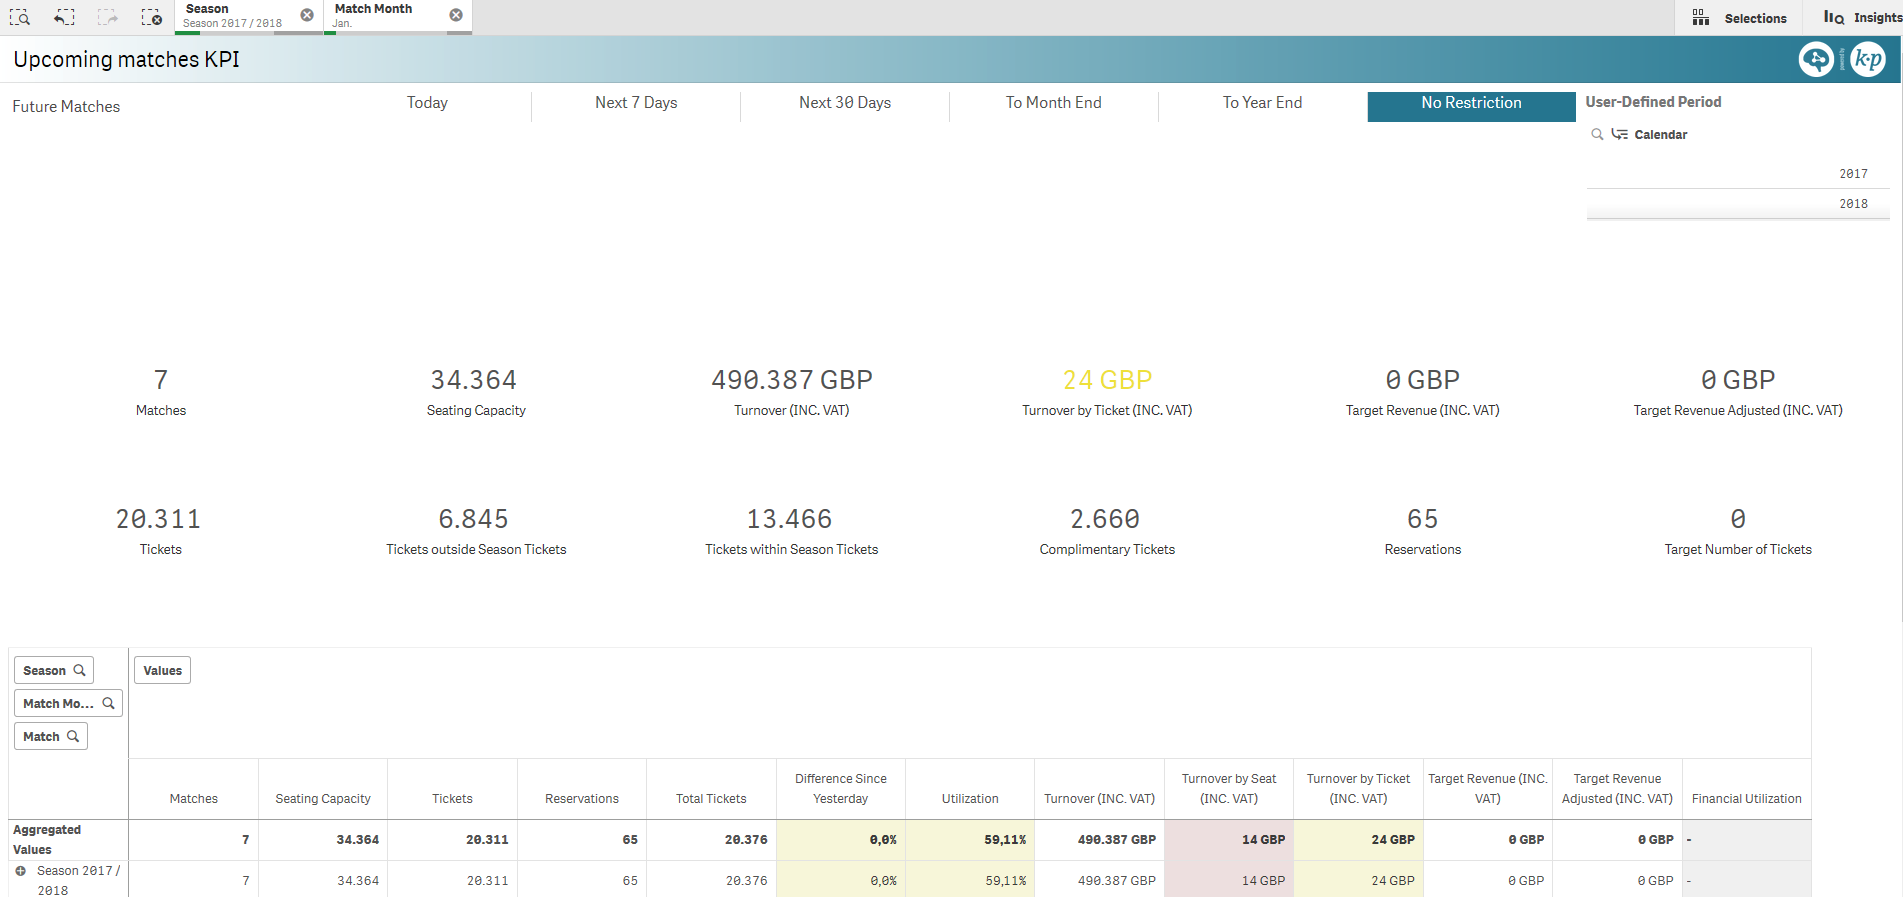
| Upcoming matches KPI | Key Performance Indicators (KPI) for the upcoming matches |
|
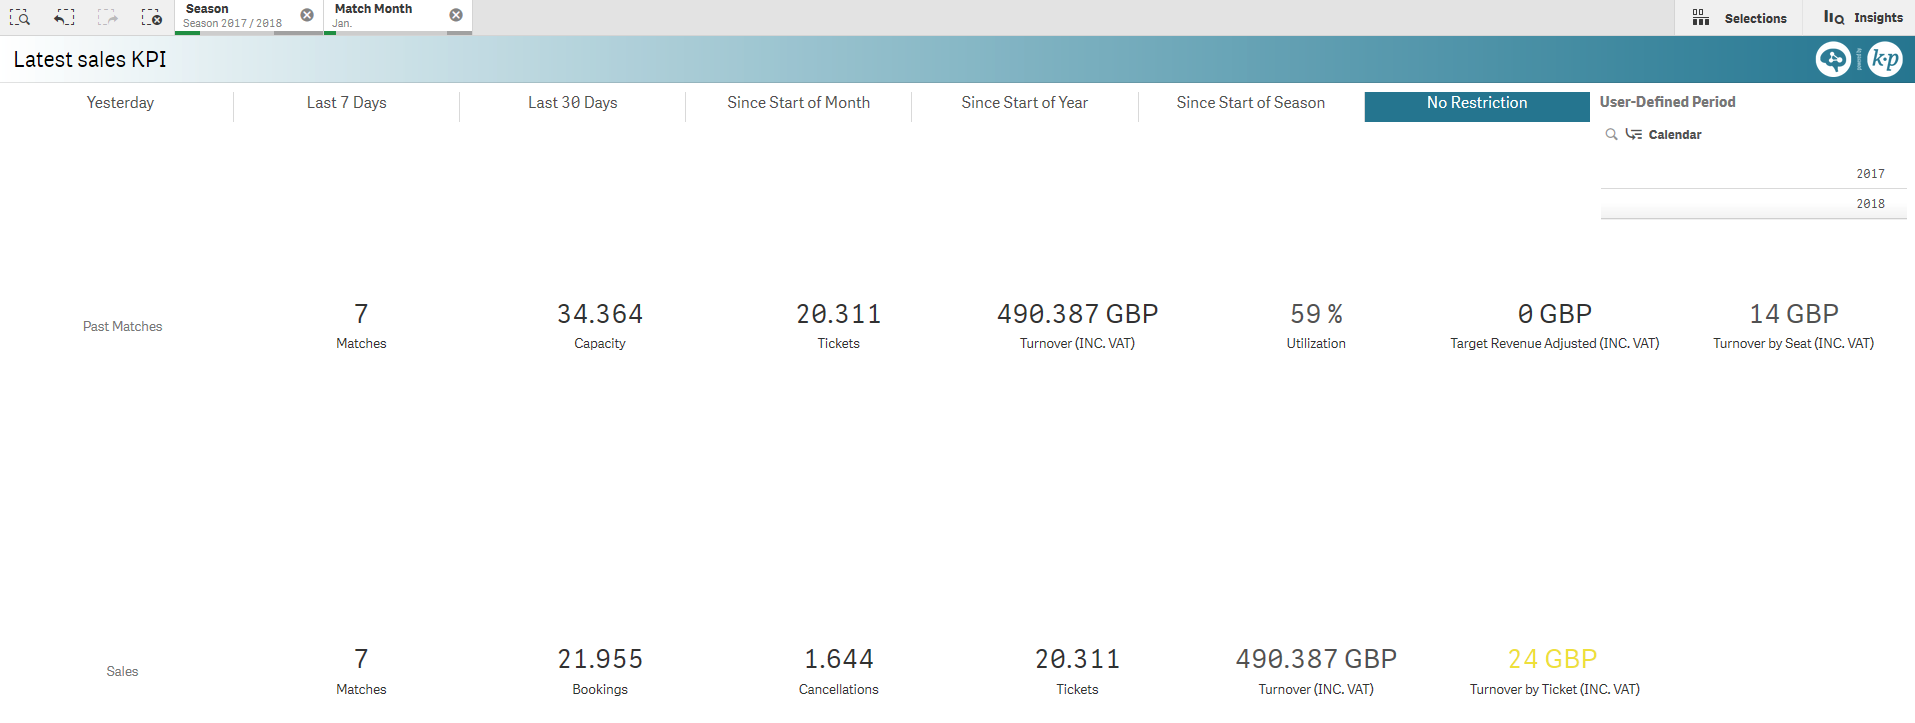
| Latest sales KPI | KPI for the latest sales, i.e, based on the sales date |
|
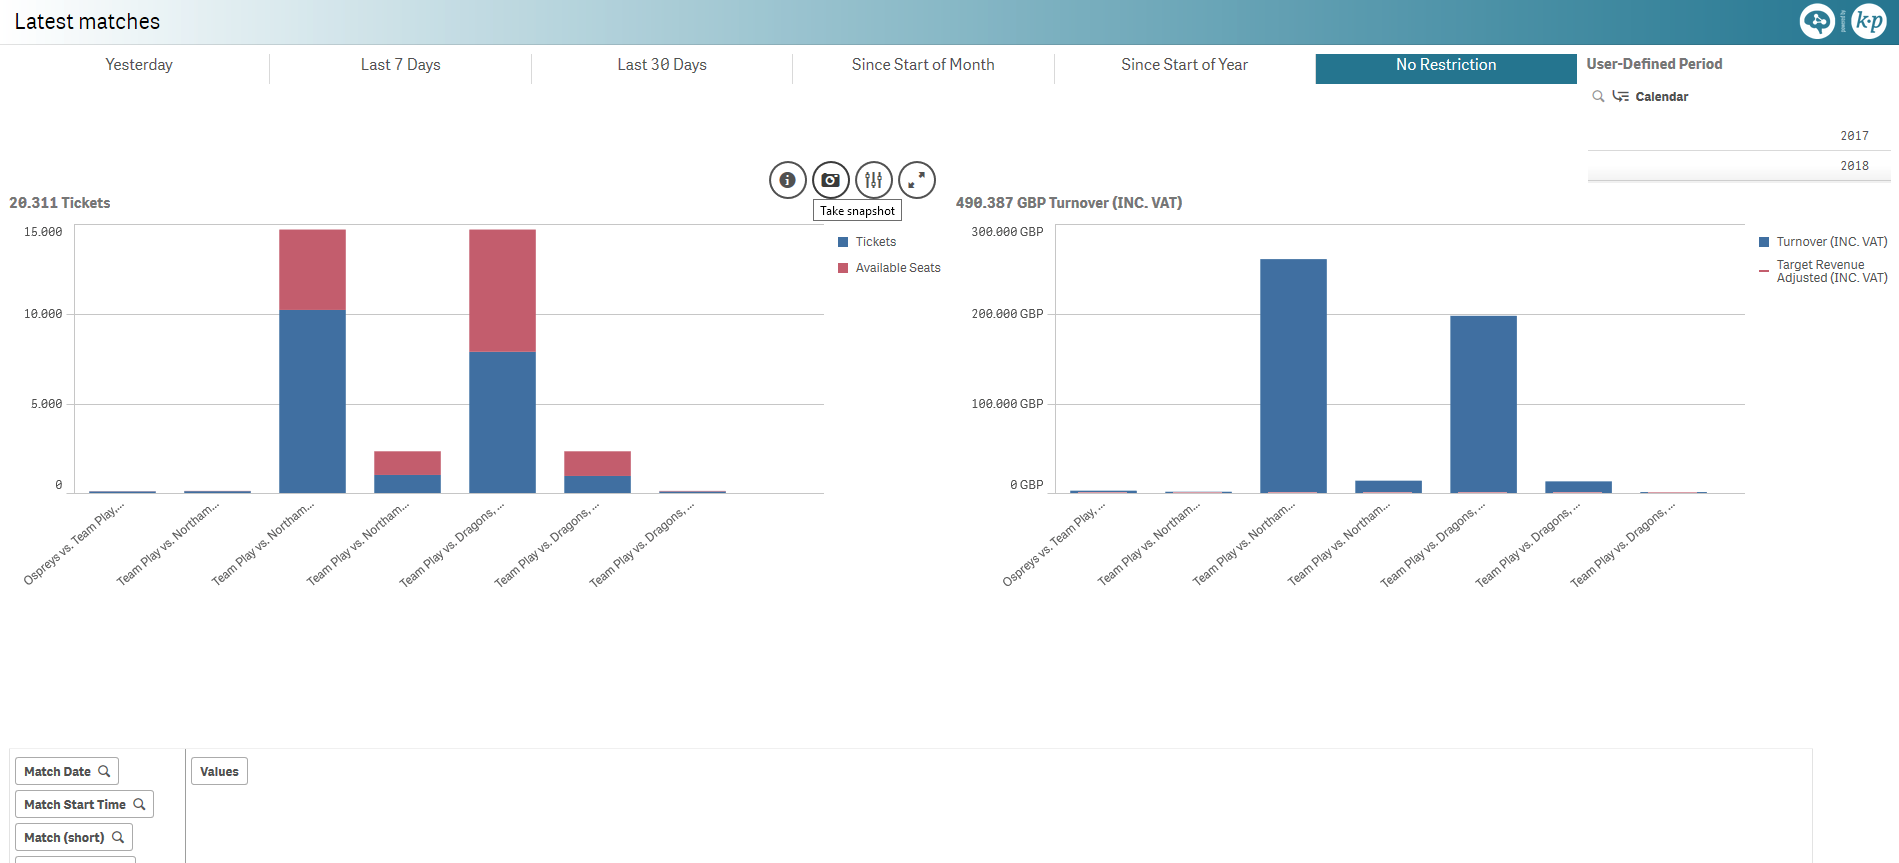
| Latest matches | Ticket and revenue charts for the latest matches with respect to the full quota and target revenue respectively. |
|
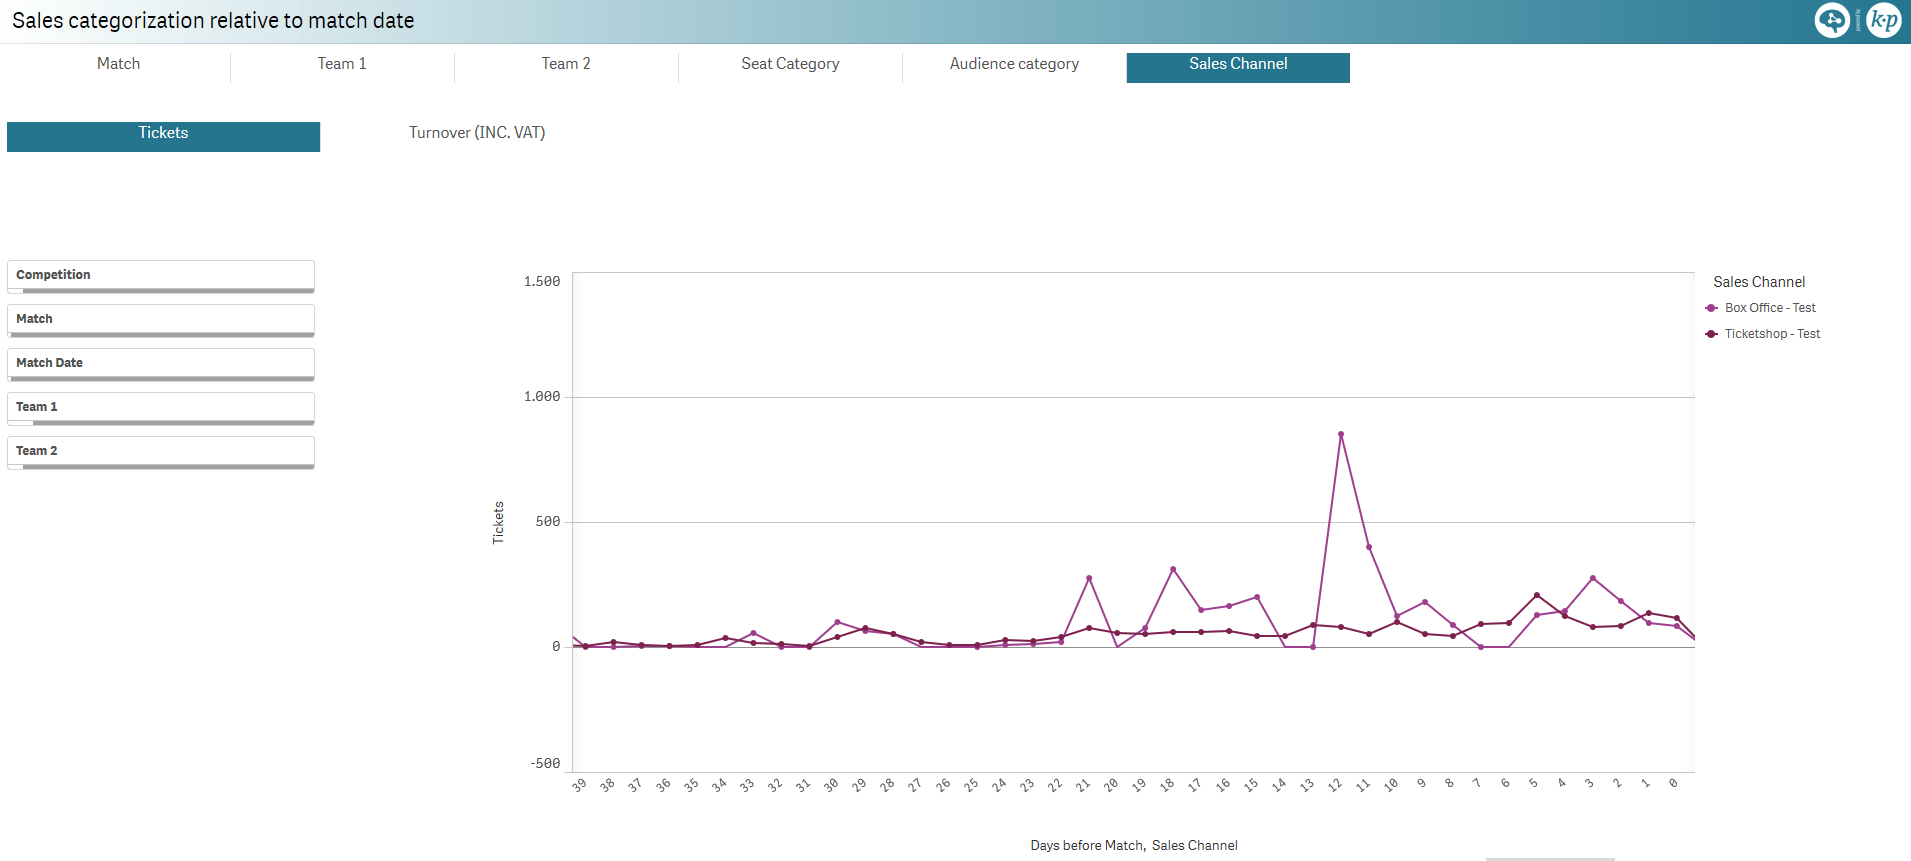
| Sales categorization relative to match date | Comparing ticket sales or revenue with respect to match date for the following dimensions:
Includes team logo display |
|
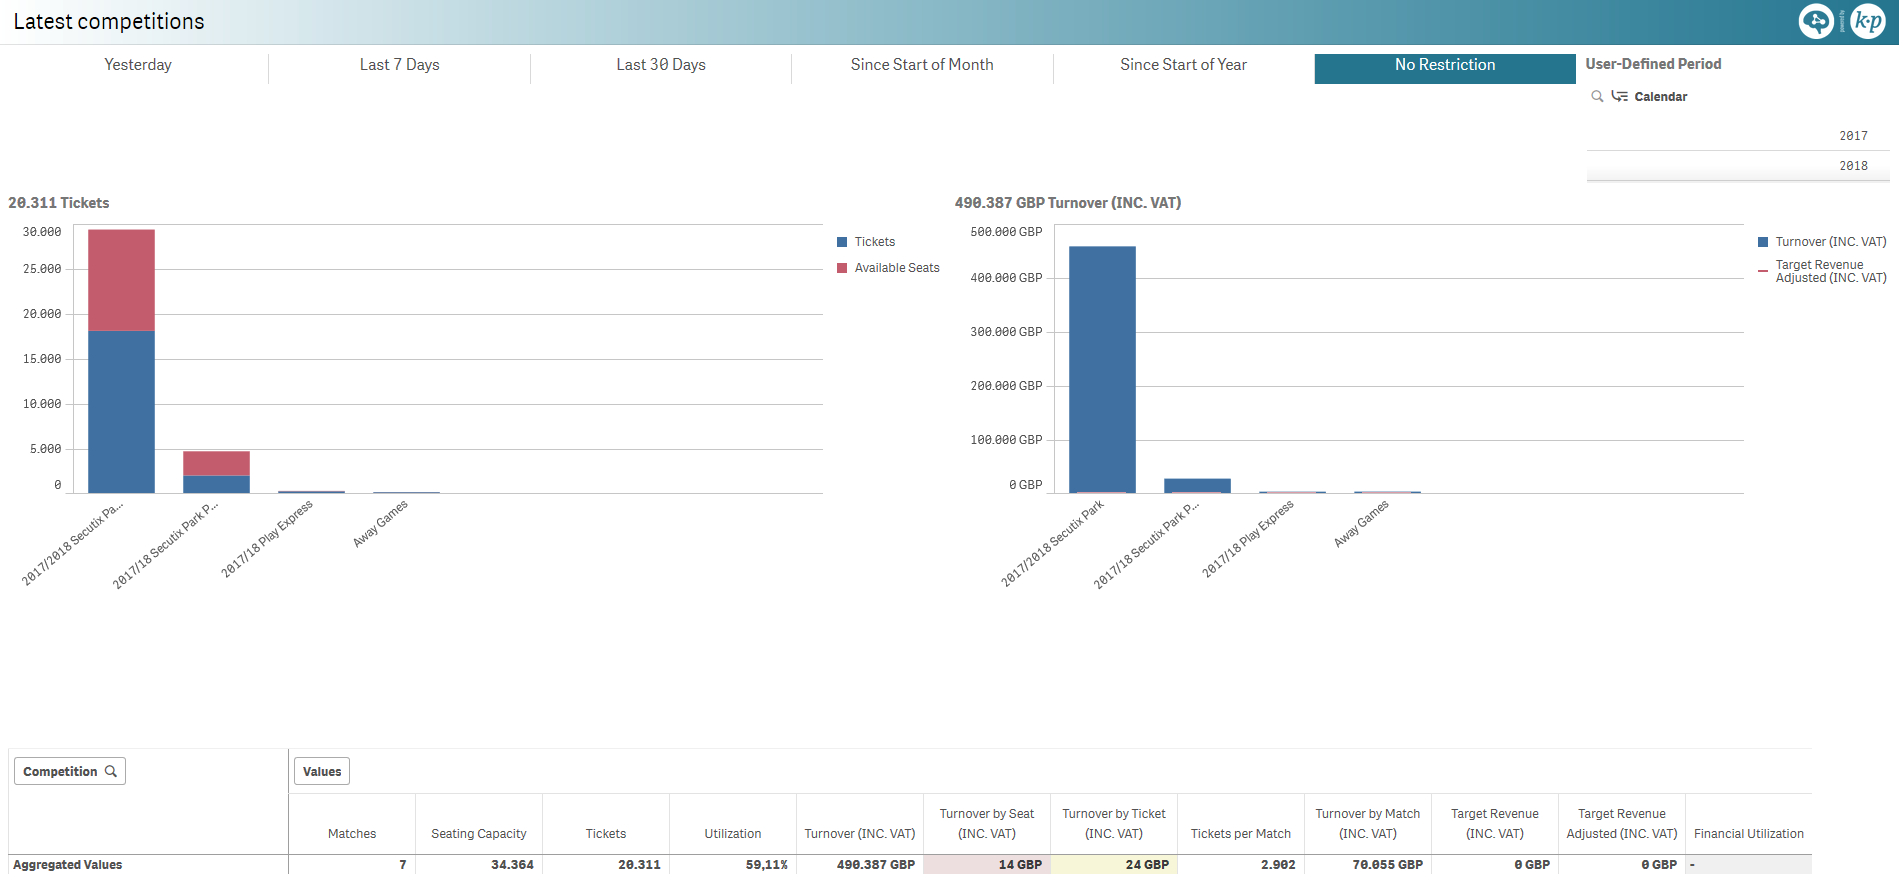
| Latest competitions | Ticket and revenue charts for the latest competitions with respect to the full quota and target revenue respectively |
|
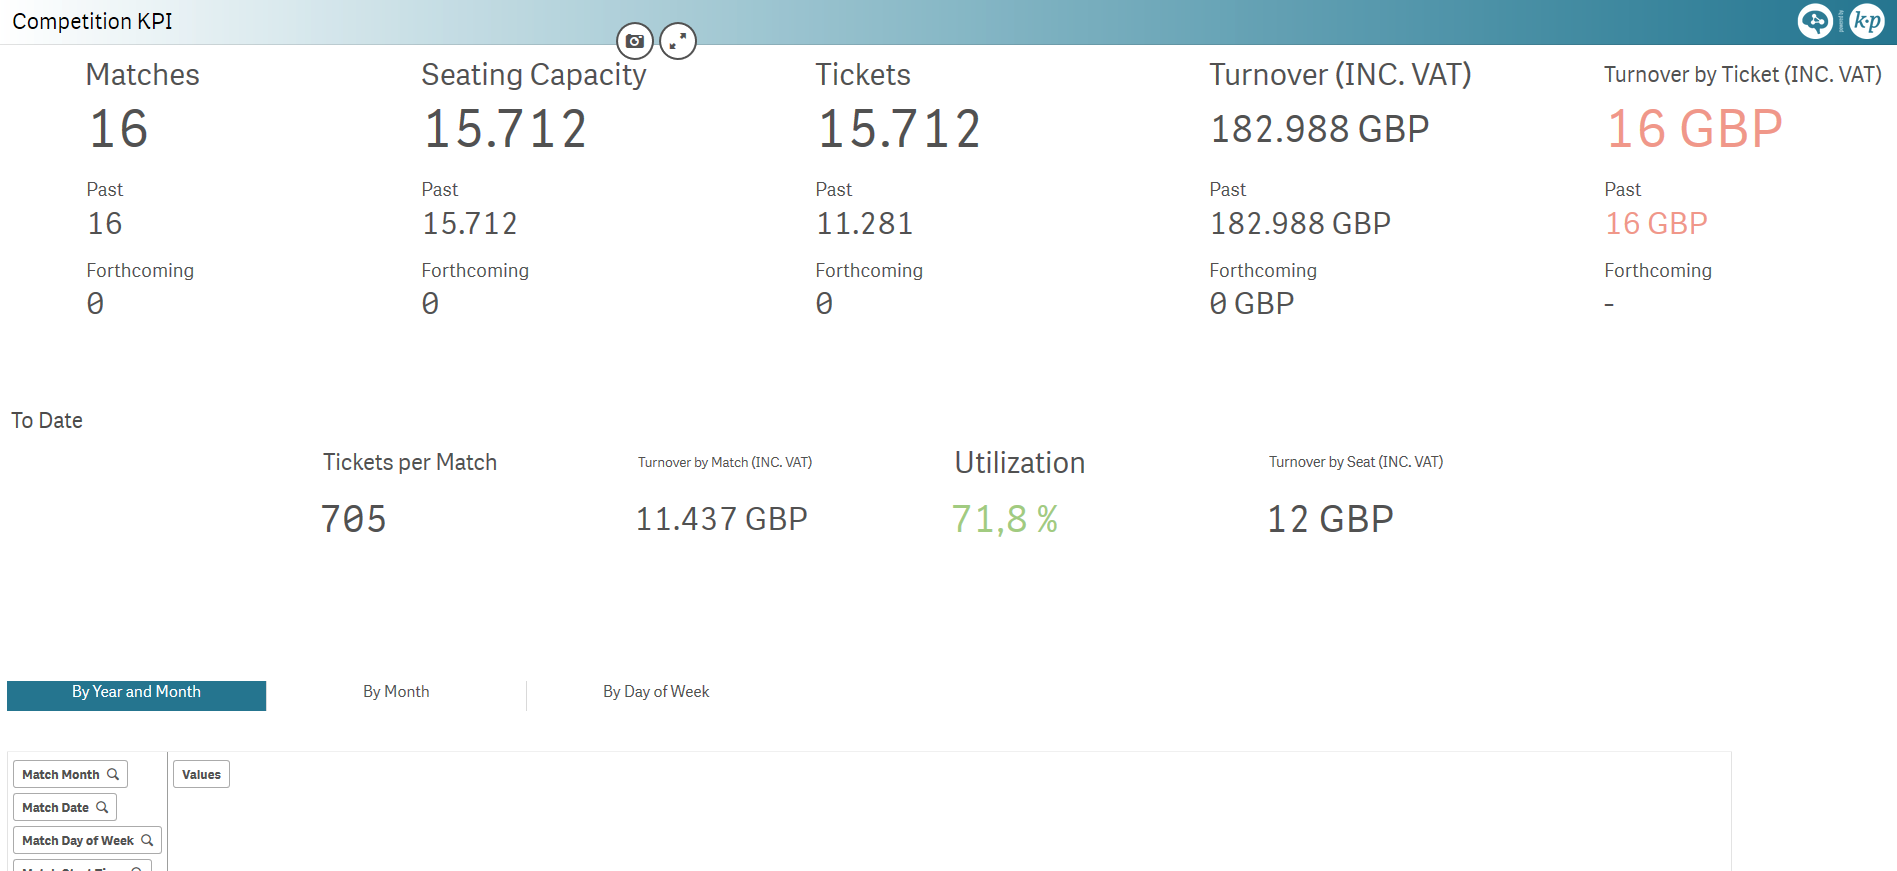
| Competition KPI | KPI for an ongoing competition, with a split on past and forthcoming matches:
and a view on the sales to date for the entire competition:
Note: Best for a selected competition |
|
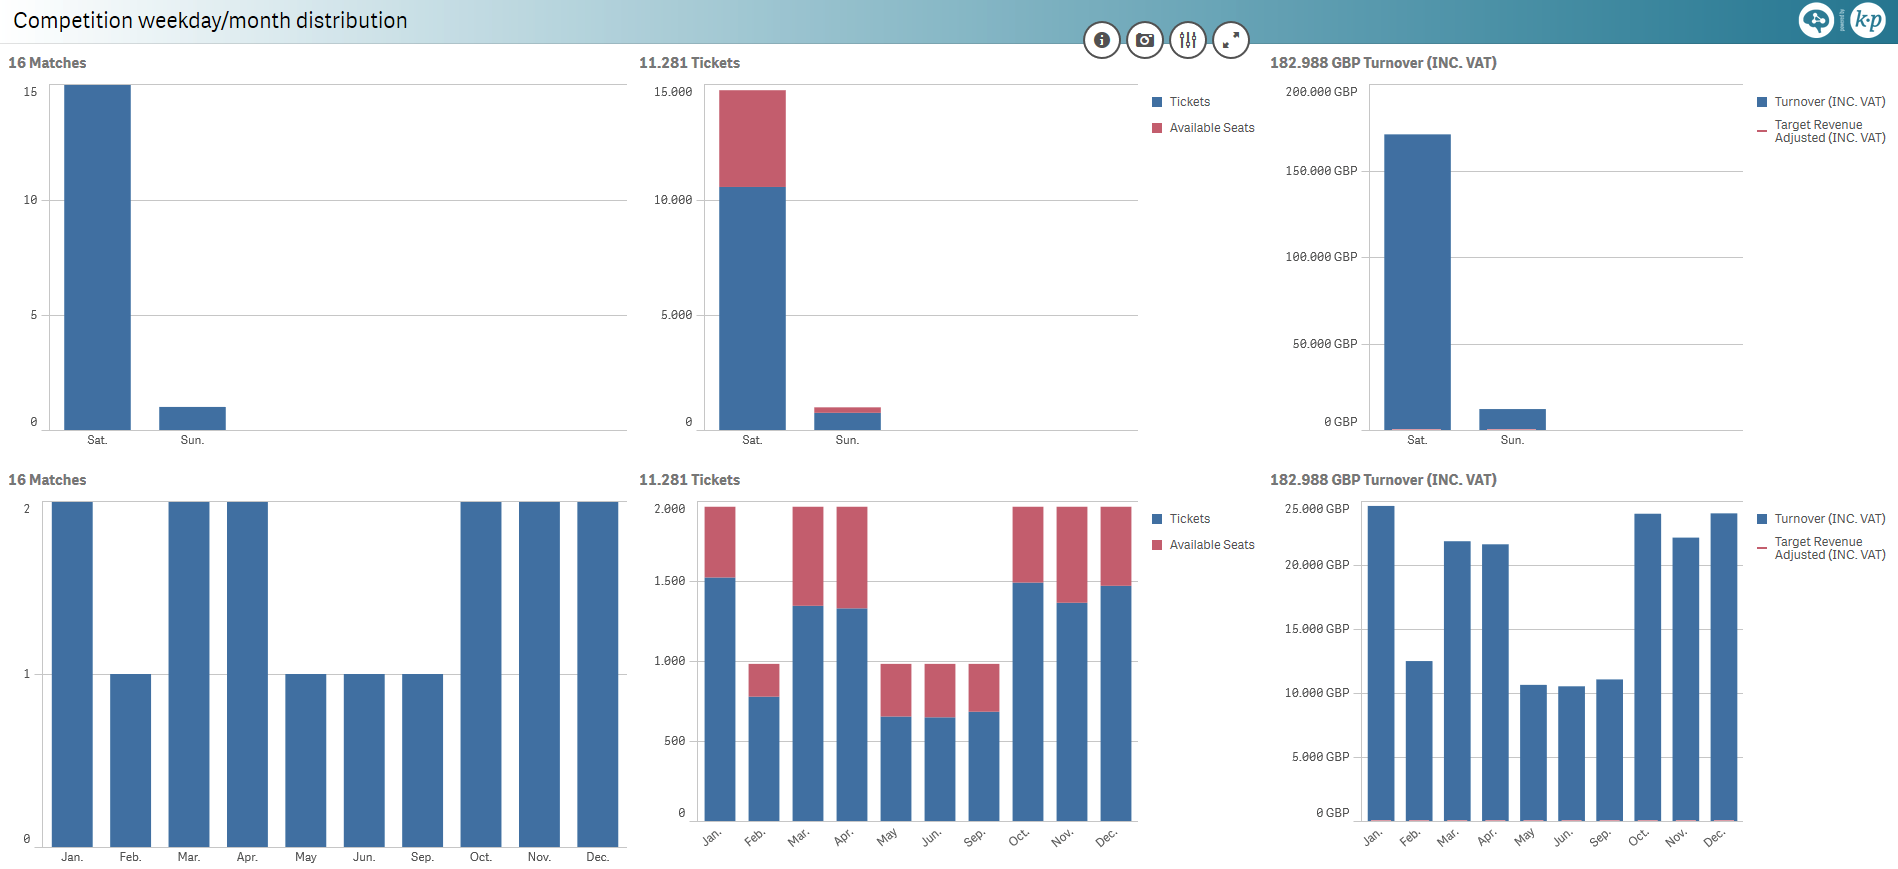
| Competition weekday/month distribution | Number of matches, sold tickets and revenue charts distributed over:
|
|
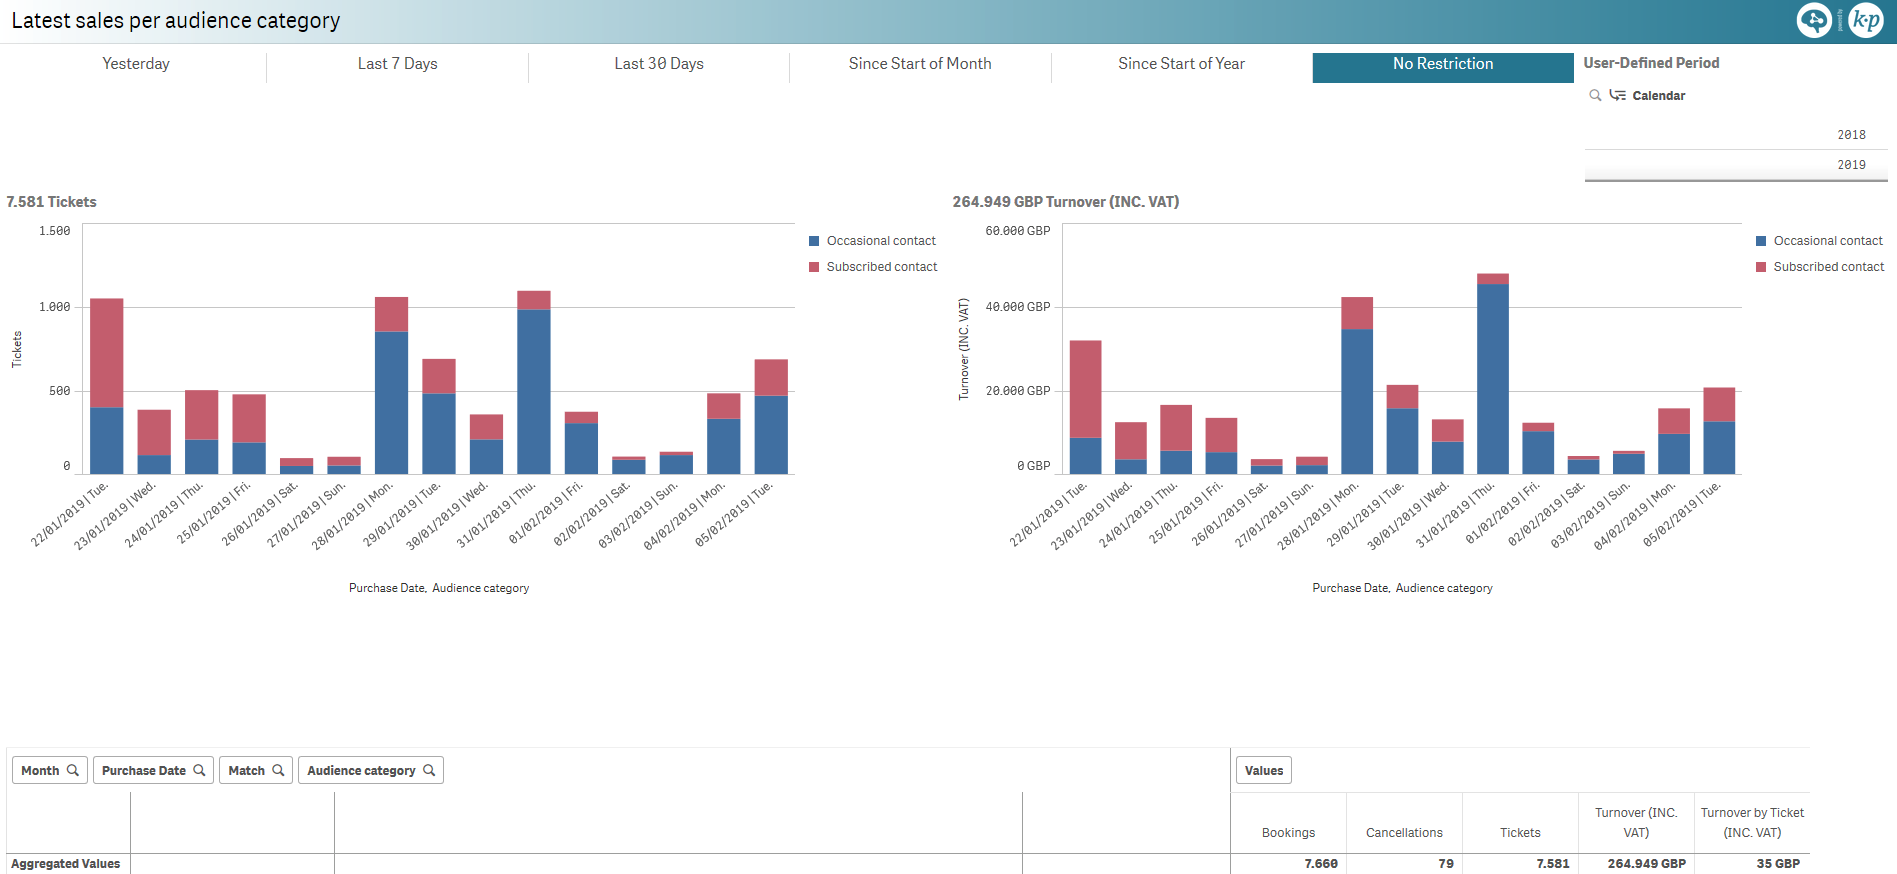
| Latest sales per audience category | Latest ticket sales and revenue per sales date, split by audience category |
|
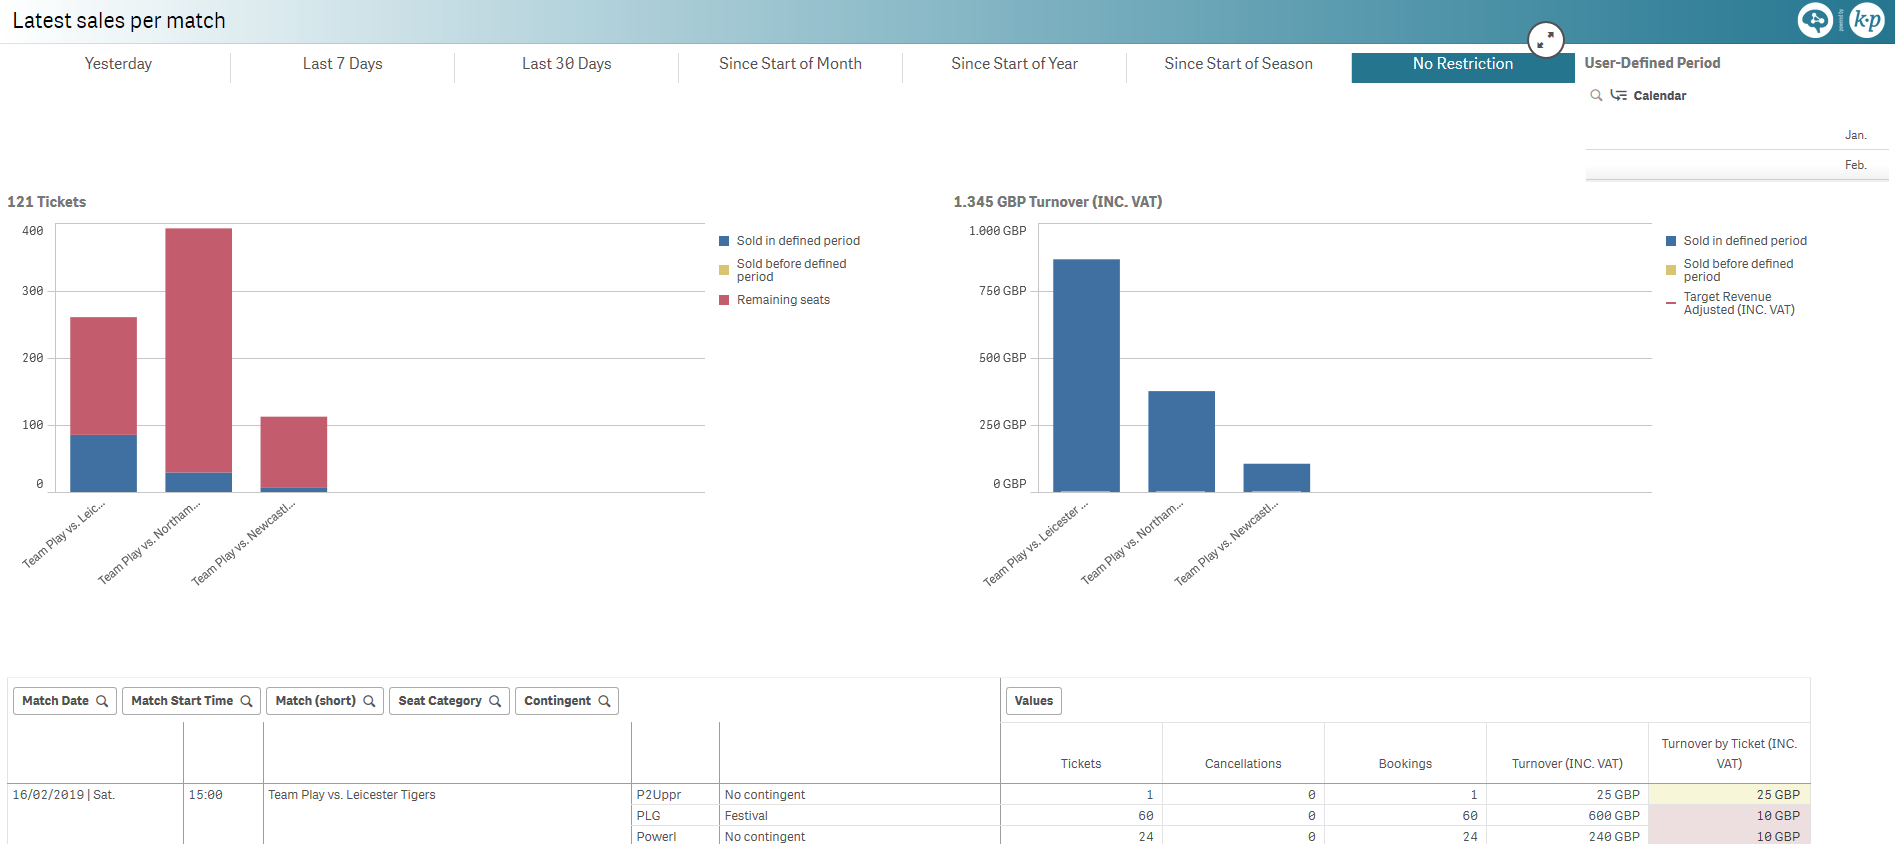
| Latest sales per match | Ticket sales and revenue per match, split between latest sales and prior sales |
|
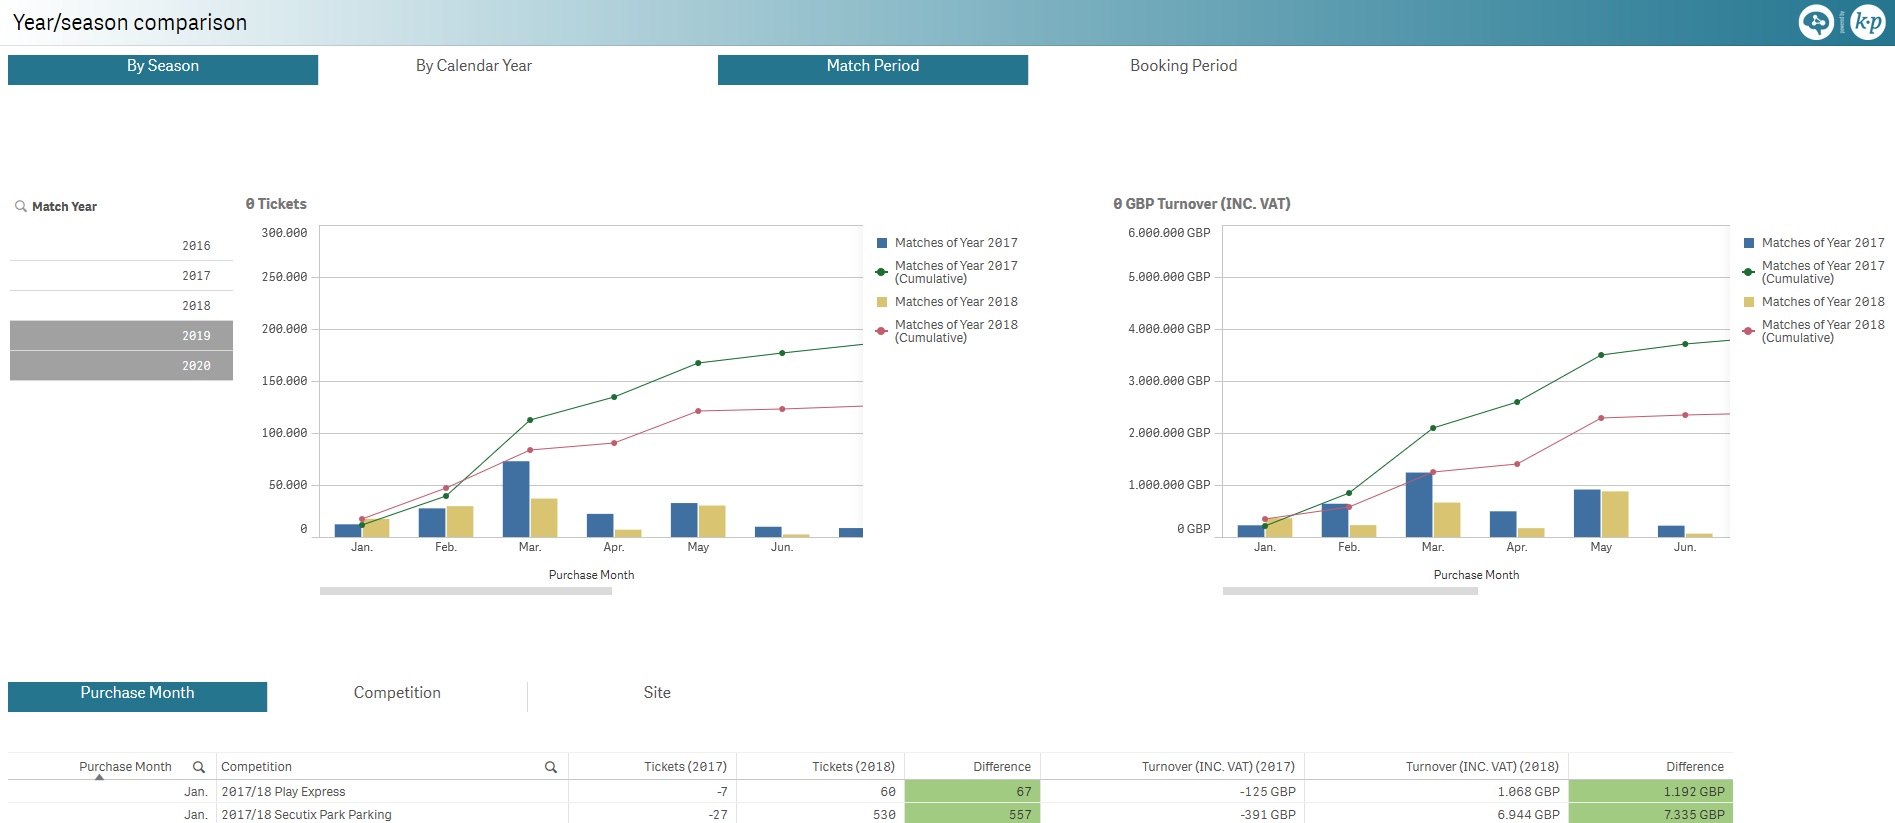
| Year/season comparison | Ticket sales and revenue monthly comparison over two seasons or years, including cumulative numbers |
|
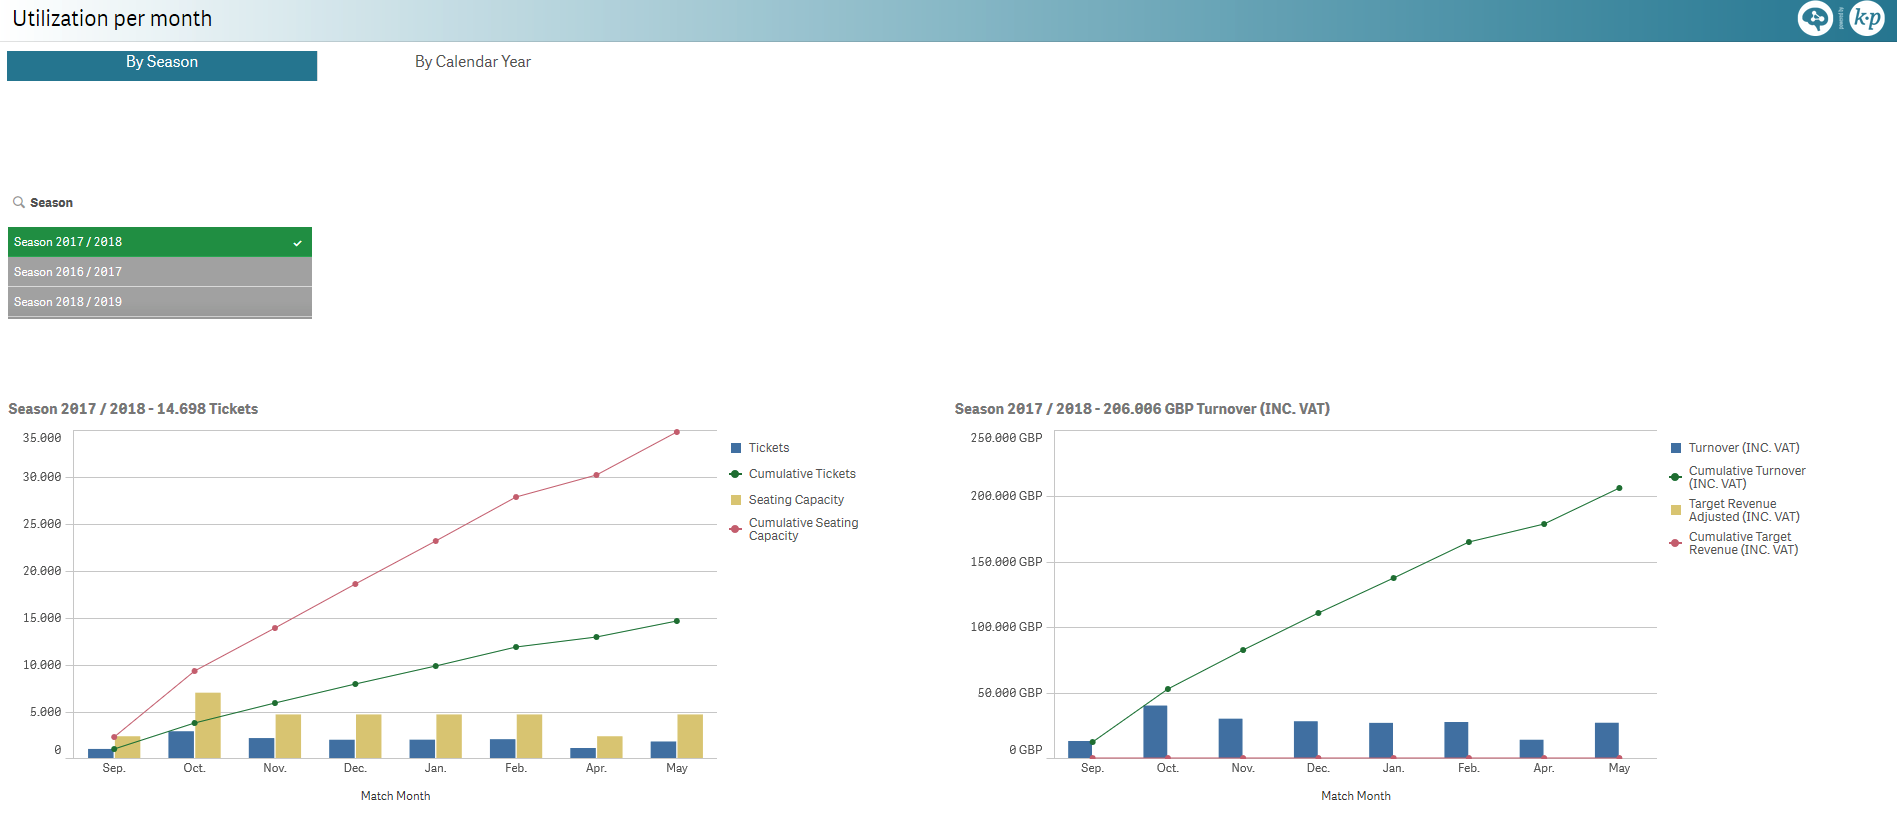
| Utilization per month | Ticket sales and revenue monthly comparison with respect to the full quota and target revenue respectively |
|
| Sales potential per match/seat cat. | ||
| Configuration seat map | ||
| Sales timeline seat map | ||
| Venue utilization | ||
| Seasonal utilization | ||
| Competition life cycle | ||
| Sales period | ||
| Sales cross-distribution | ||
| Season ticket KPI | ||
| Season ticket per season | ||
| Season ticket sales period | ||
| Contact cross-distribution | ||
| Loyalty transition flow | ||
| Access control seat map | ||
| Access control timeline seat map | ||
| Access control time distribution | ||
| Customer knowledge seat map | ||
| Ticket Resales | ||
| Season Ticket Usage |