...
| Rapports de ventes | Description
| ||||||
|---|---|---|---|---|---|---|---|
| Catégories de places - Vue matricielle | This report displays tickets or revenue data organized by events and performances. For each event or performance you can see the various information by seat categories. This enables you to get a better understanding of how your seat categories perform per event/performanceCe rapport affiche des informations telles que le nombre de billets vendus, le CA ou encore la capacité organisées par événements et séances. Pour chaque événement ou séance vous avez différentes informations clés par catégories de places. Cela vous permet de voir comment préforment vos catégories de places par événements ou séances. | ||||||
| Catégories de places - État des ventes | For each performance and seat categories, get to know the breakdown of the sales! See how many tickets have been sold full price, reduced, complimentary , etc. This enables a better understanding of the breakdown of each seat categories. | Ce rapport vous donne la décomposition des ventes par séances et catégories de places. Cela vous permet de voir combien de billets ont été vendus à prix plein, réduit ou gratuit. Il vous offre une meilleure compréhension de la décomposition de chaque catégorie de places. | |||||
| Plan de salle - Séance individuelle | Choisissez une séance et visualisez le plan de salle par catégories de places et secteurs | Plan de salle - Séance individuelle | Select a specific performance and vizualize your seat map by seat categories or sectors. | ||||
Plan de salle - Historique des ventes | Select a specific performance and use the scroll bar on the top to vizualize how your seats were sold in the time with a breakdown by kind of tickets (full price, reduced, season tickets, etc). This helps you to understand which kind of audiences book their tickets first. You can thus sharpen your marketing strategySélectionnez une séance et utilisez la barre de défilement du haut afin de visualiser comment se sont vendus vos sièges dans le temps selon le type de billets (prix plein, réduit, dans le cadre d'un abonnement, etc). Cela vous aide à comprendre à quel moment un type de public donné prend ses billets et à affûter votre stratégie marketing en conséquence.
| ||||||
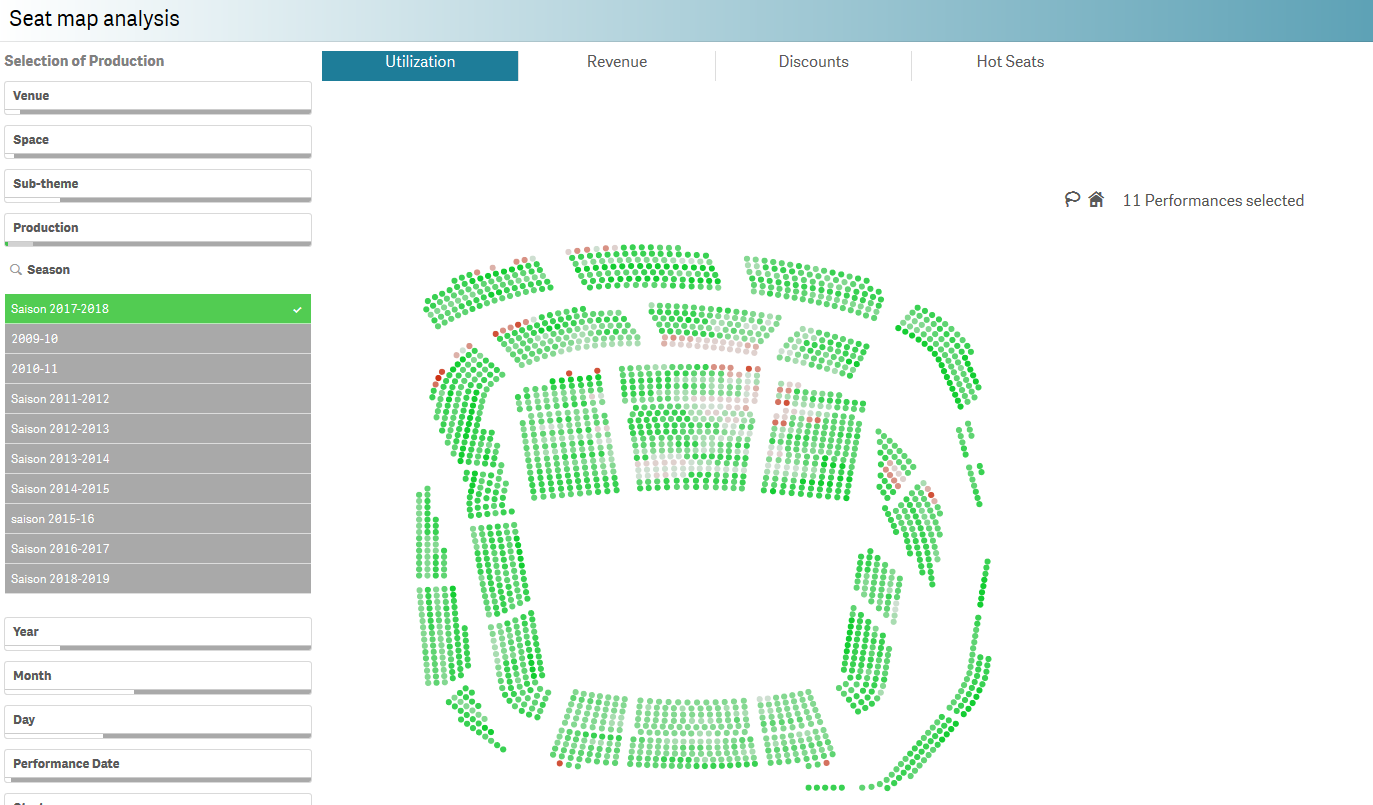
| Analyse du plan de salle | This report enables a gaphical analysis of your seat map for a chosen time frame. Then select if you want to see the seat map in terms of utlization, revenue, discounts or hot seats (seats that are sold very fastCe rapport vous offre un analyse graphique du plan de salle sur une période donnée. Choisissez si vous voulez voir le plan de salle en termes de fréquentation, de CA, de tarifs réduit ou encore de hot seat (sièges qui se vendent le plus vite). | ||||||
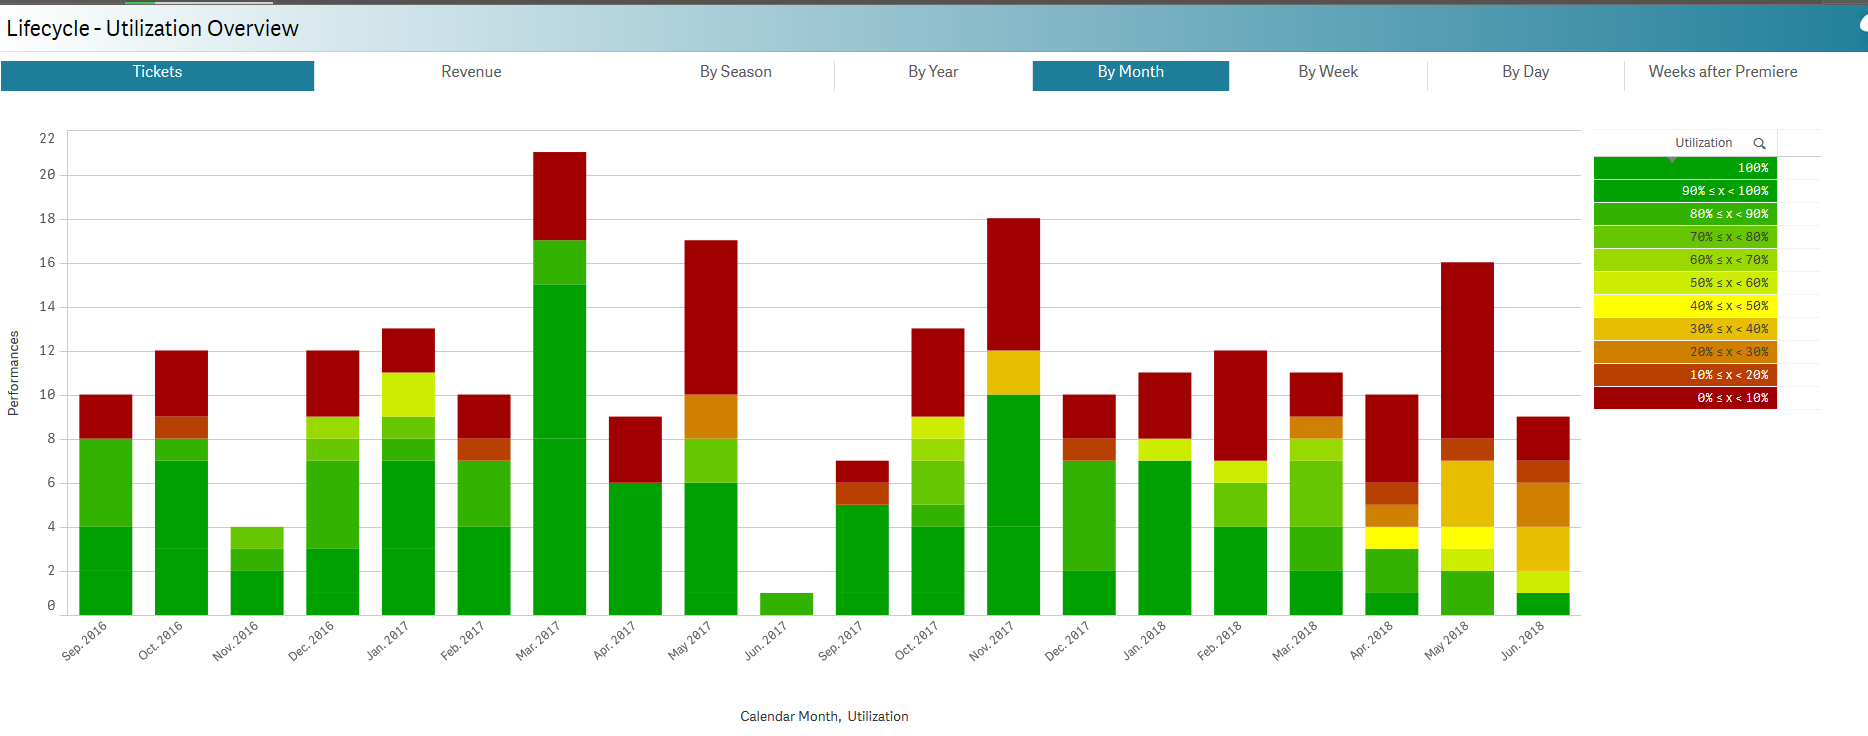
| Cycle de vie - Vue d'ensemble de la fréquentation This report is one of the most useful for a season analyis. You decide if you want to analyze your data in terms of tickets sold or revenue and then, select the time unit for comparison. Drill down from a season view to a months view with a click and how your activity is doing compared to last year/month/season/etc. See below a comparison by months over two seasons in terms of utulization. | Ce rapport est l'un des plus utile pour analyser votre saison. Vous décidez si vous voulez analyser vos données en termes de billets vendus ou de CA et l'unité temporelle de votre analyse. Vous pouvez ensuite explorer vos données en abaissant la granularité Saisons > Mois > Semaines etc. Ci-dessous, une comparaison de la fréquentation des séances par mois. | ||||||
| Cycle de vie - Période de l'événement | Ce rapport vous permet d’acquérir une meilleure compréhension de vos événements multi-séances. Le focus se fait sur la date de séance et permet entre autres de comparer les séances d'un même événement pour voir comment elles performent en termes de fréquentation ou de CA | Cycle de vie - Période de l'événement | This report will help to get a better understanding of events with multiple performances. The focus is set on the performance date and among others it helps you to compare how each performance of a same event is performing in terms of revenue or attendance. | ||||
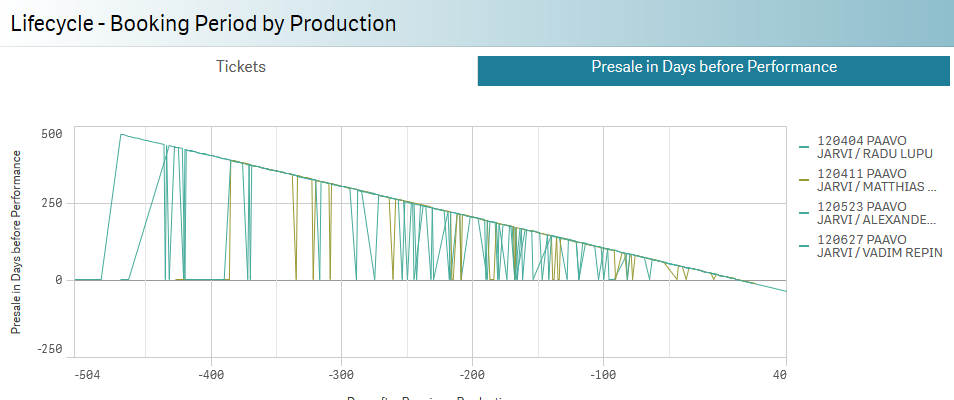
| Cycle de vie - Date d'achat de l'événement | This report is also made for multiple performances events but it focuses on the date of purchase. It helps you to understand when did people purchase their tickets: was it last minute or long time before the Ce rapport est également adapté aux événements multi-séances mais se concentre sur la date d'achat. Il vous aide à comprendre la temporalité d'achat des billets: était-ce plutôt à la dernière minute ou au contraire longtempsavant la Première? | ||||||
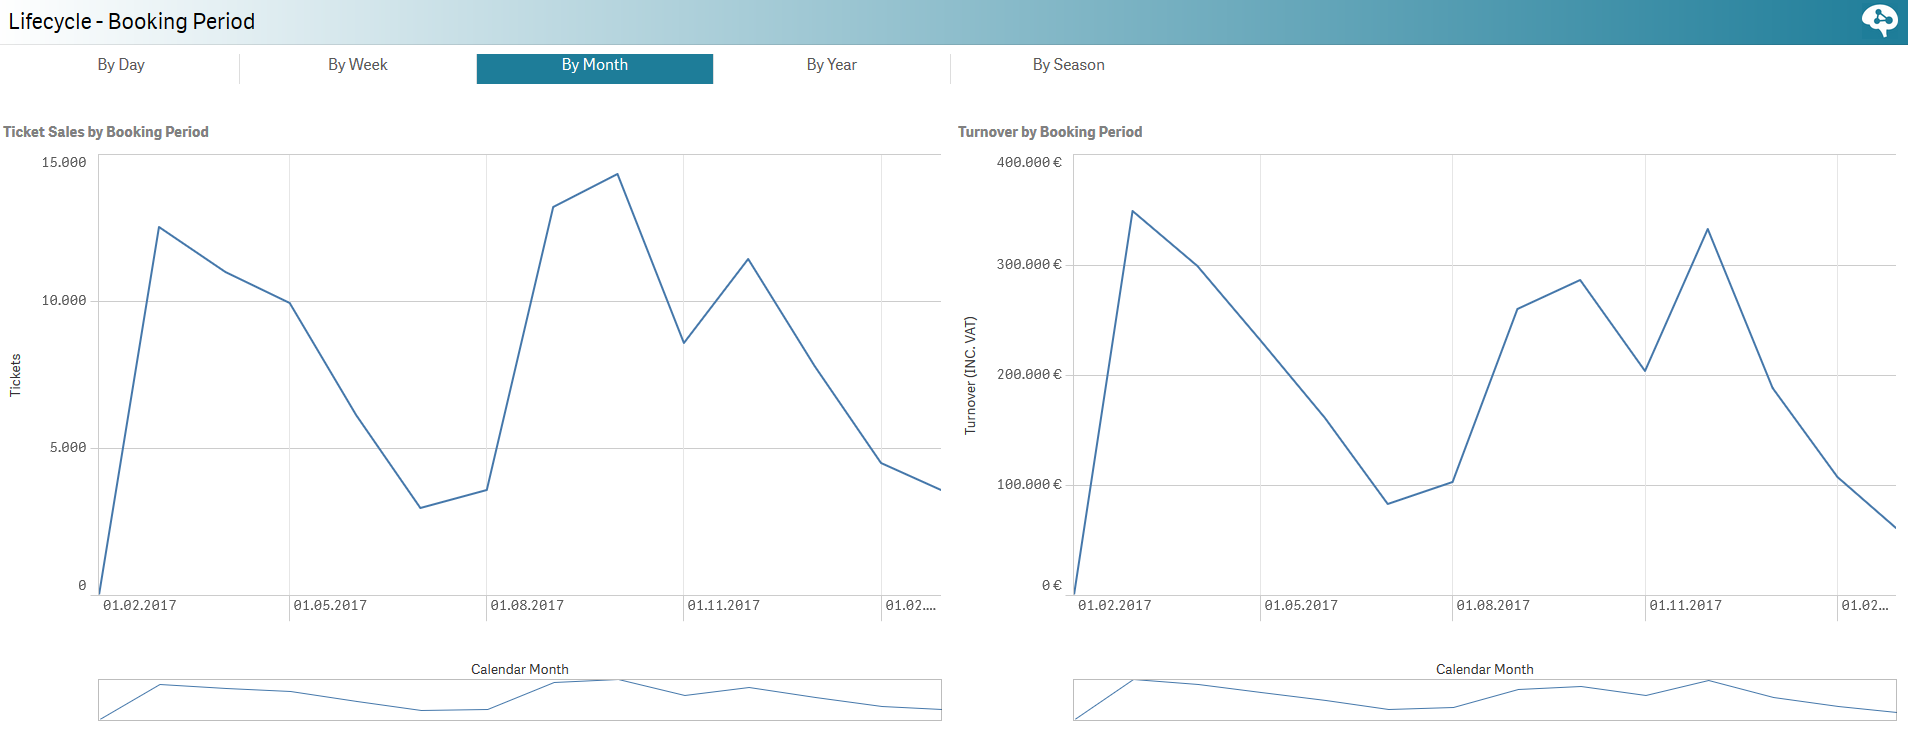
| Cycle de vie - Date d'achat | This report gives you insights in terms of sold tickets and turnover on a set of selected data (events, seasons, months, etc). The graphic below show us the booking timeline for the Season 17/18 by monthsCe rapport vous donne des informations en termes de billets vendus et de CA sur une sélection de données de votre choix (événements, saisons, mois, etc). Le graphique ci-dessous montre les achats répartis dans le temps pour la saison 17/18. | ||||||
| Analyse des tendances d'achat | Sales Trend history shown in two graphics (absolute or relative and by performance) in terms of tickets or revenue, (and in terms of price categories, sales channels, audience category or ticket types) | ||||||
| Comparaison des tendances d'achat | ?? | ||||||
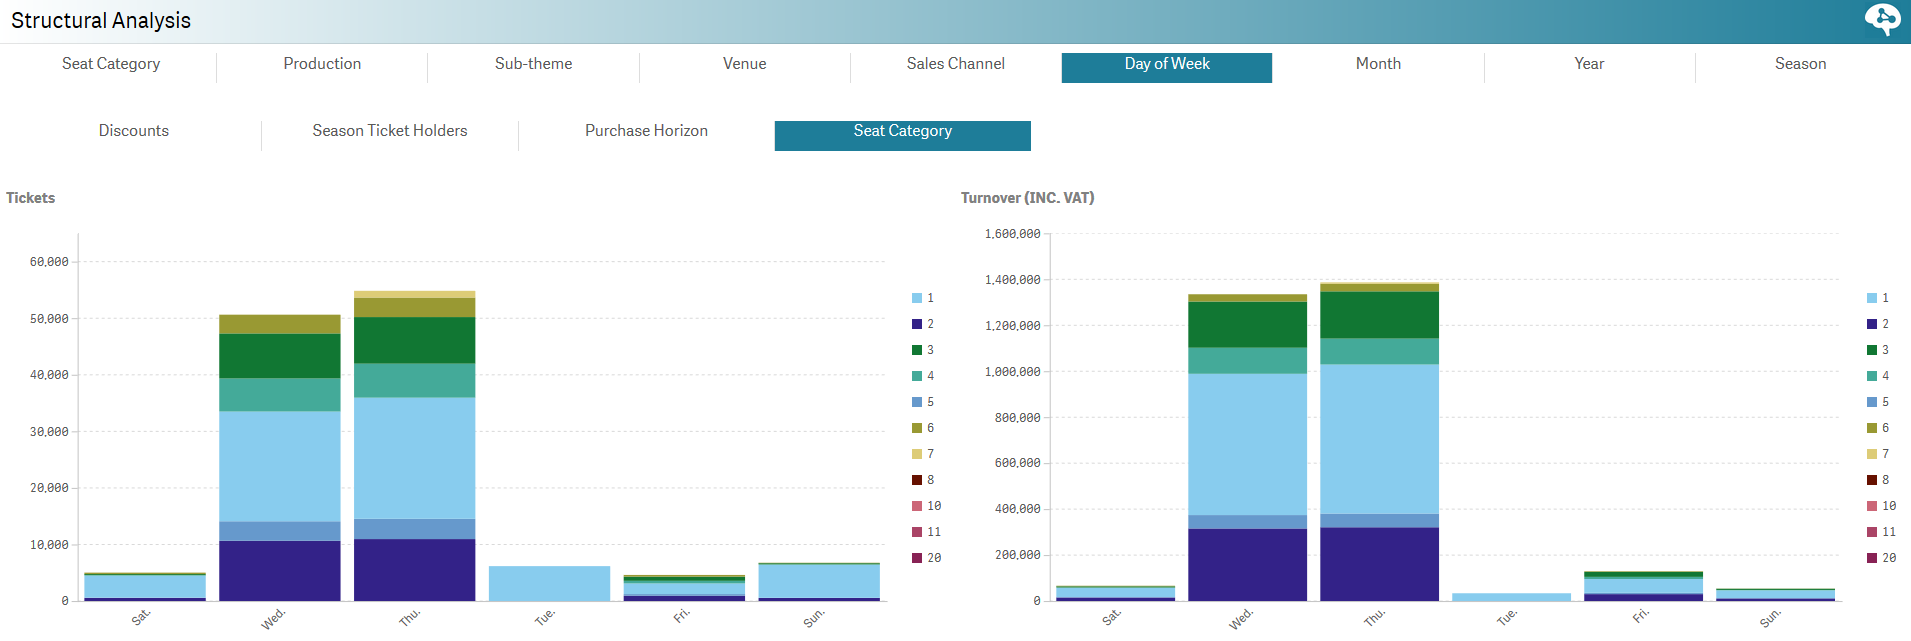
| Analyse structurelle | This report is a must! It enables the user to get a better understanding of the sales through a fine-grained analysis of different dimensions. The bar chart and the table automatically update the data depending on the user's selection. It is for exemple possible to see how the different seat categories are sold regarding the sales channels or the day of the weekCe rapport est un must! Il permet une meilleure compréhension de vos ventes à travers une analyse fine et plus-dimensionnelle. Les tableaux se mettent automatiquement à jour en fonction de votre sélection de données. Il est par exemple possible de voir comment se vendent les différentes catégories de places par filières de vente ou jour de la semaine. | ||||||
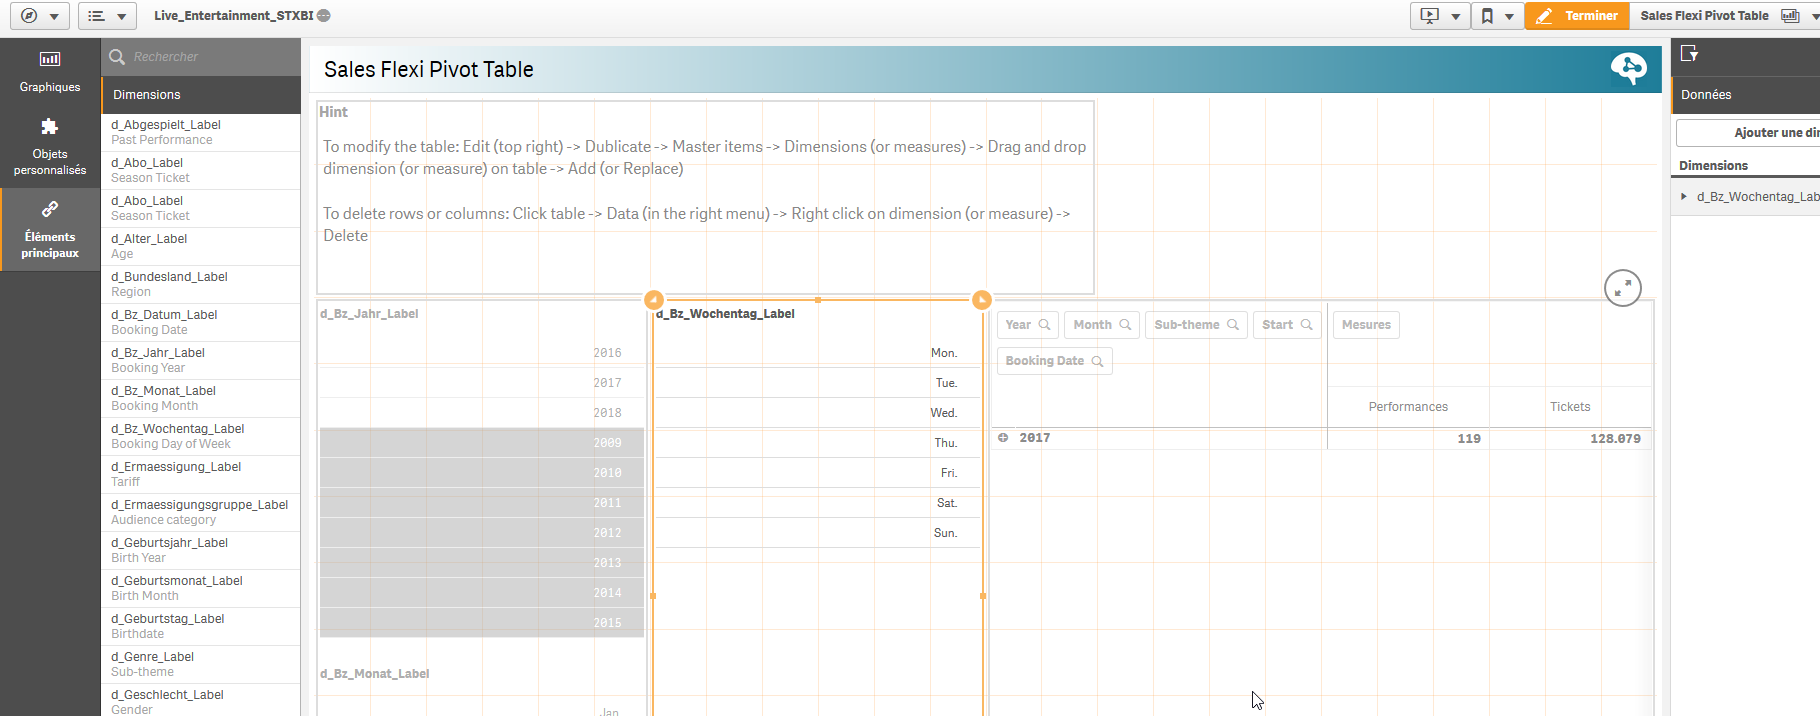
| Flexi Pivot des ventes | Using the drag & drop function, you can build your own tables. To do so, please copy the report sheet and edit the copy.You can then select dimensions and drag & drop them to get your data. Like a flexi pivot table in Excel, you can use formula to apply to your data. En utilisant la fonction glisser/déposer, vous pouvez construire votre propre rapport! Pour ce faire, il suffit de dupliquer le rapport et de sélectionner via un glisser/déposer les dimensions & mesures que vous souhaitez analyser. Tout comme un tableau croisé dans Excel, vous pouvez utiliser des formules sur vos données. | ||||||
| Analyse des abonnements | This report gives you specific insights on your season tickets sales: number of sales, turnover it represents, amount of tickets it represents, etc. You can compare seasons tickets from different seasons and see how they perform in terms of sales, ticket sold within a season ticket and tunroverCe rapport vous donne des informations clés sur les ventes de vos abonnements: volumes de ventes, CA, nombre de billets vendus dans les abonnements, etc. Vous pouvez ainsi comparer vos différentes formules d'abonnements. | ||||||
Abonnements - Détails | It is always interesting to know which events and performances season tickets holder prefer. In this report, you can see the top events and performances selected by the season ticket holders. This report is of great help to design your next season offersIl est toujours intéressant de savoir quels événements et quelles séances sont les plus plébiscités par les abonnés. Dans ce rapport, vous verrez les événements et séances préférés de vos abonnés. Il est idéal pour définir les formules d'abonnements des saisons à venir. | ||||||
| Ventes d'abonnements | Ce rapport se concentre sur la temporalité des ventes de vos formules d'abonnements. Vous y voyez par date d'achat, mois ou années d'achat vos ventes d'abonnements. | ||||||
| Ventes d'adhésions | Ce rapport est entièrement dédié aux adhésions. Vous gagnerez une meilleure compréhension de ces produits de fidélisation et verrez quelles adhésions sont les plus plébiscitées par vos publics, le CA que cela représente ainsi que les pics de ventes | This report focuses on the sales timeline of your season tickets products! See by date, month or year when your selection of season tickets was sold! Get a better understanding of the sales timing and sharpen your marketing strategy accordingly! | Ventes d'adhésions | This report is all about Memberships! Get a better understing of this loyalty product and know which of your memberships are the most successfull, the turnover they represent and when are the sales peaks. IMAGE!!! |
| Gestion du Public | Description
| ||||||
|---|---|---|---|---|---|---|---|
| Direct Marketing - Sélection des filtres | This is where you can make a selection of contacts. The two first columns are where you enter you inclusive and exculive contacts selection criteria. You can add additional filters on the number of purchased tickets, the turnover by contact, the estimation of overdue time before next visit and the number of attendance. Check also on the right-hand top of the page to see the acutal number of contacts in you selection. You can also decide if you want to look for all contacts or only purchasers (i.e. contacts with at least one purchase). Use the three buttons on your right to access to the contacts list, overview of you contacts or map view to see them on a map.
| ||||||
| Direct Marketing - Liste des contacts | After you have done your contacts selection, go to the Customer list to get a list of your contacts with basic information and specific KPIs such as next antcipated visit, average attendance frequency in days, etc. | ||||||
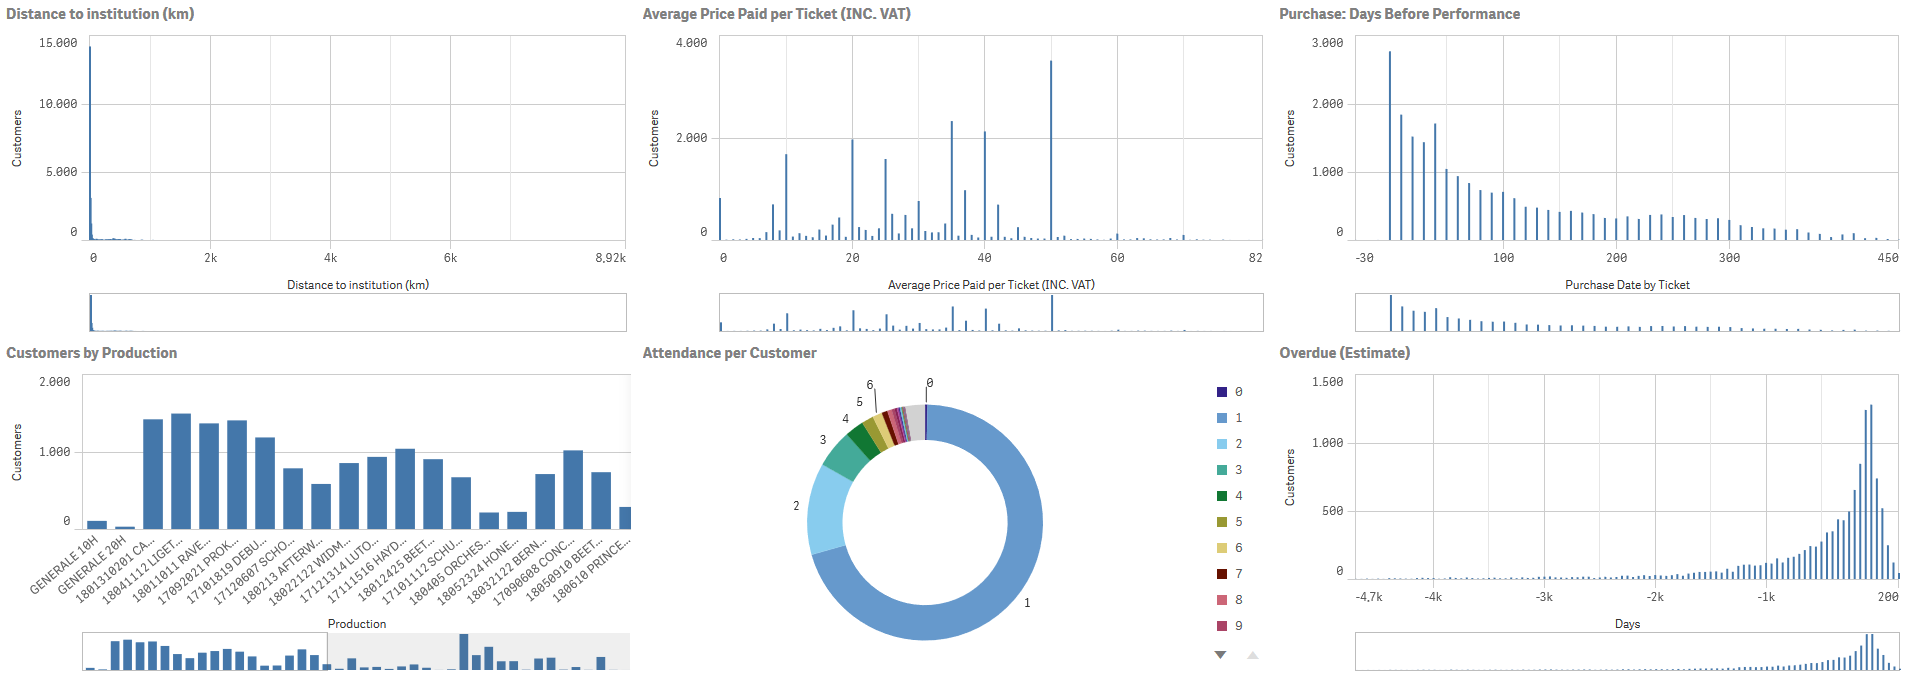
| Direct Maketing - Vue d'ensemble | Get a very visual overview of your contacts selection! See how close they live from your venue, the average price they pay for their tickets and when do they purchase them. See other key information about them such as the number of attendance! | ||||||
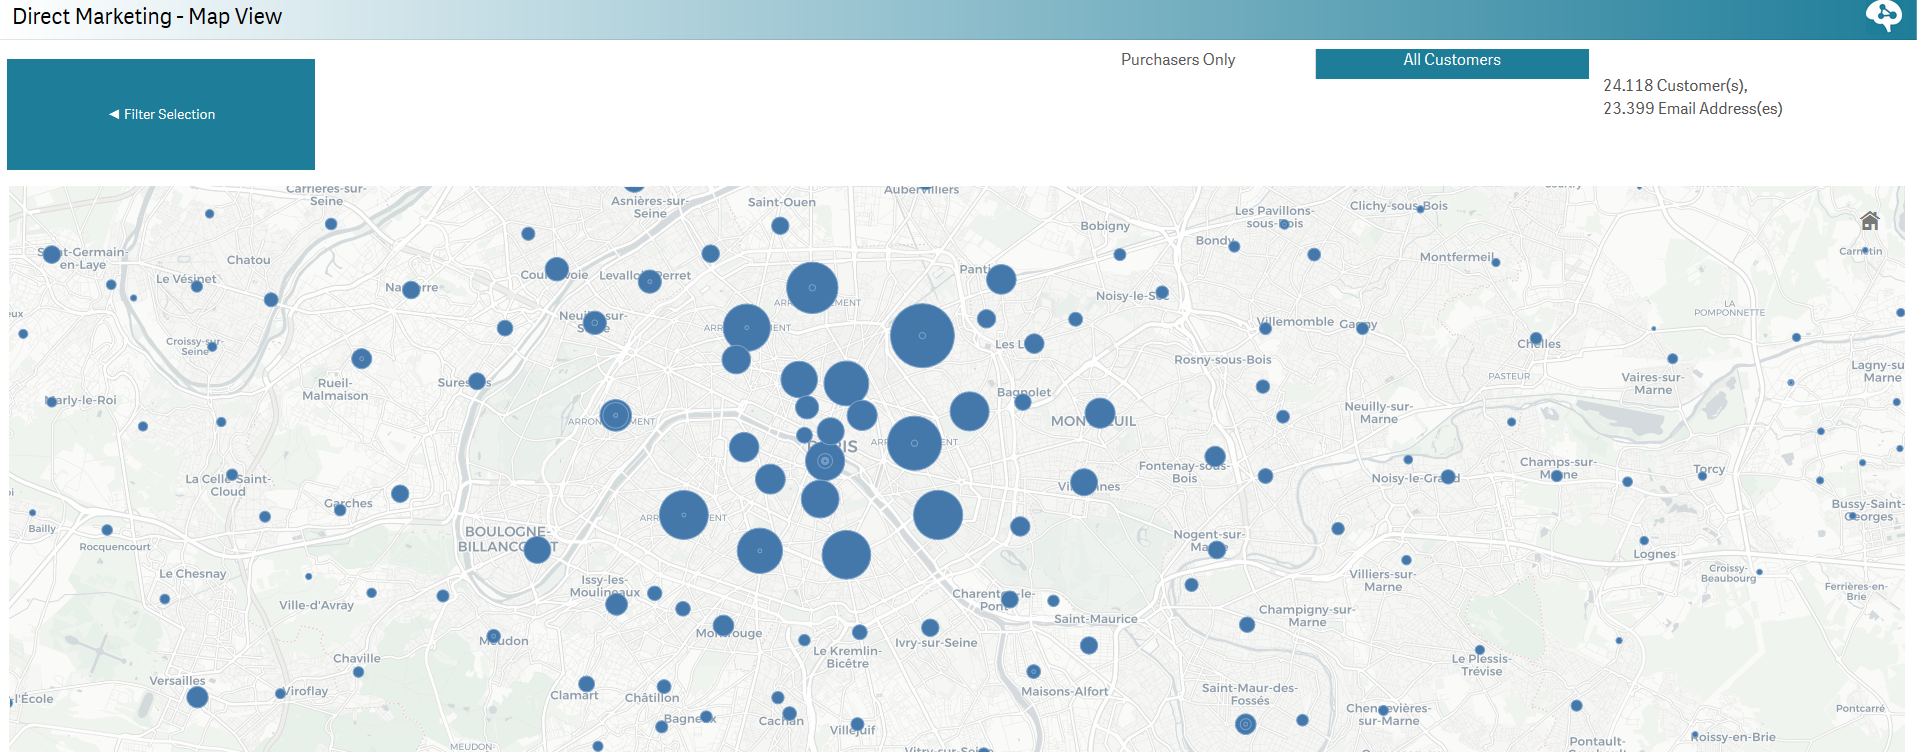
| Direct Marketing - Voir la carte | See your customers on a map! The bigger the cluster is, the more customers you have in this area. Zoom/unzoom and use the lasso selection tool to select a group of contacts. | ||||||
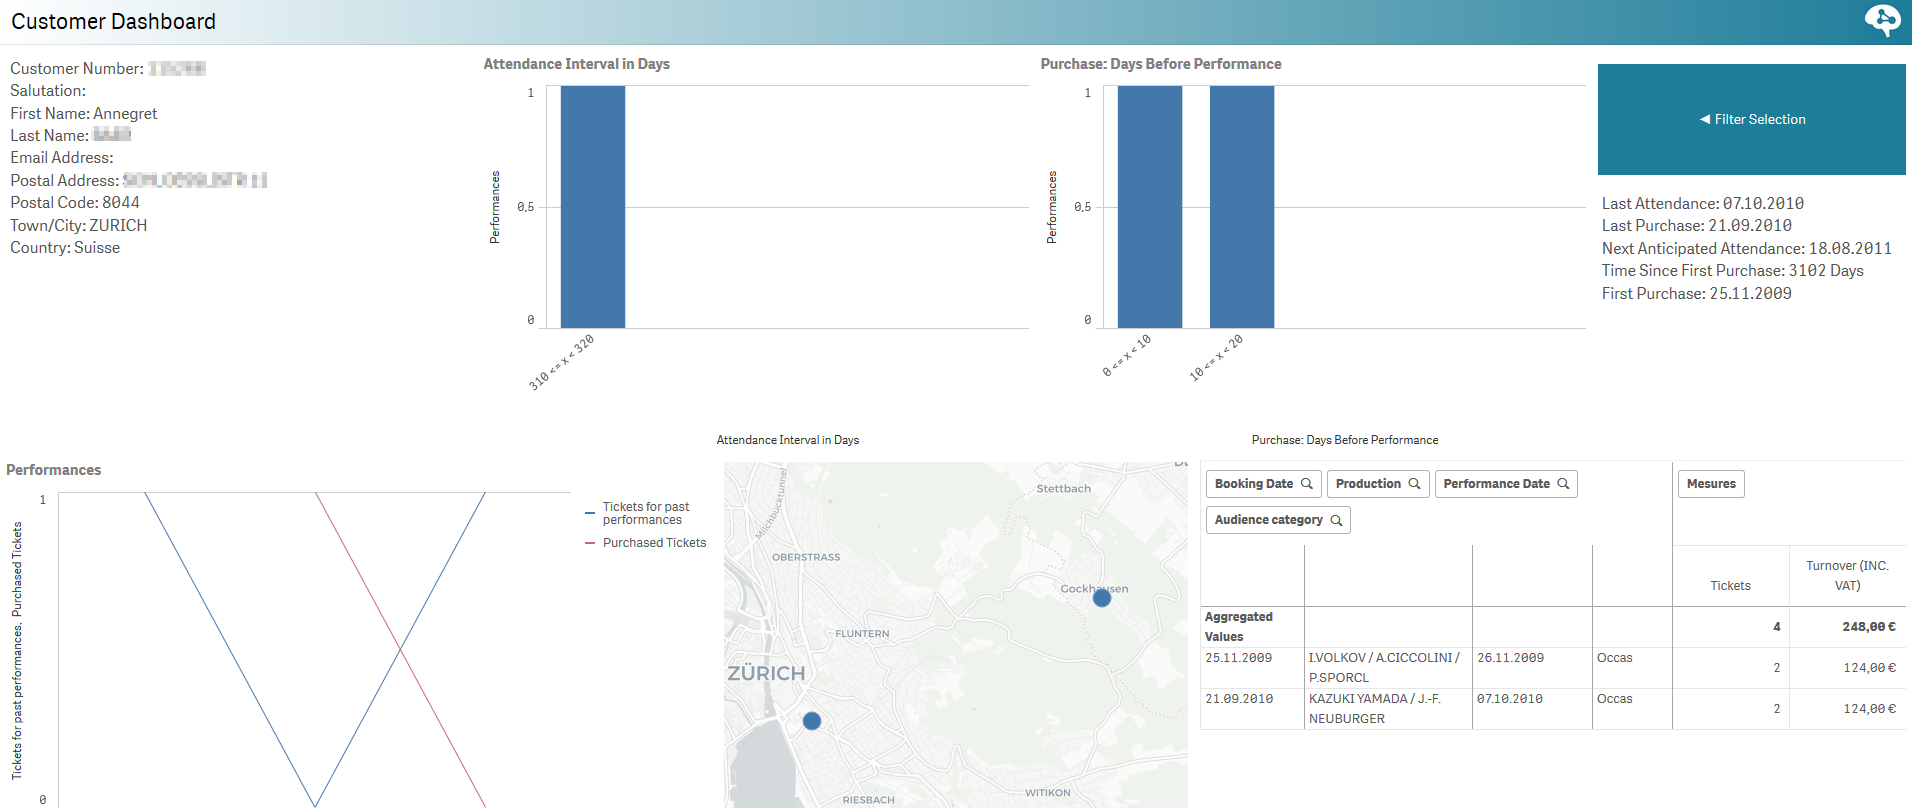
| Dashboard client | This dashboard provides you a focus on a specific contact! Get in one glance the key information about this customer such as the average interval in days between attendances, the average number in days between the purchase and the performance, his/her total turnover, etc. | ||||||
| Analyse structurelle | In this report you can analyse your audience in regard to a chosen set of dimensions. You can combine one of the dimension in the upper panel with one in the lower panel. The bar charts and the table will respond to your selection. For example, you can see which production performed best for a specific age group or gender. Or which day of the week is most popular for people you live far away from your venue. | ||||||
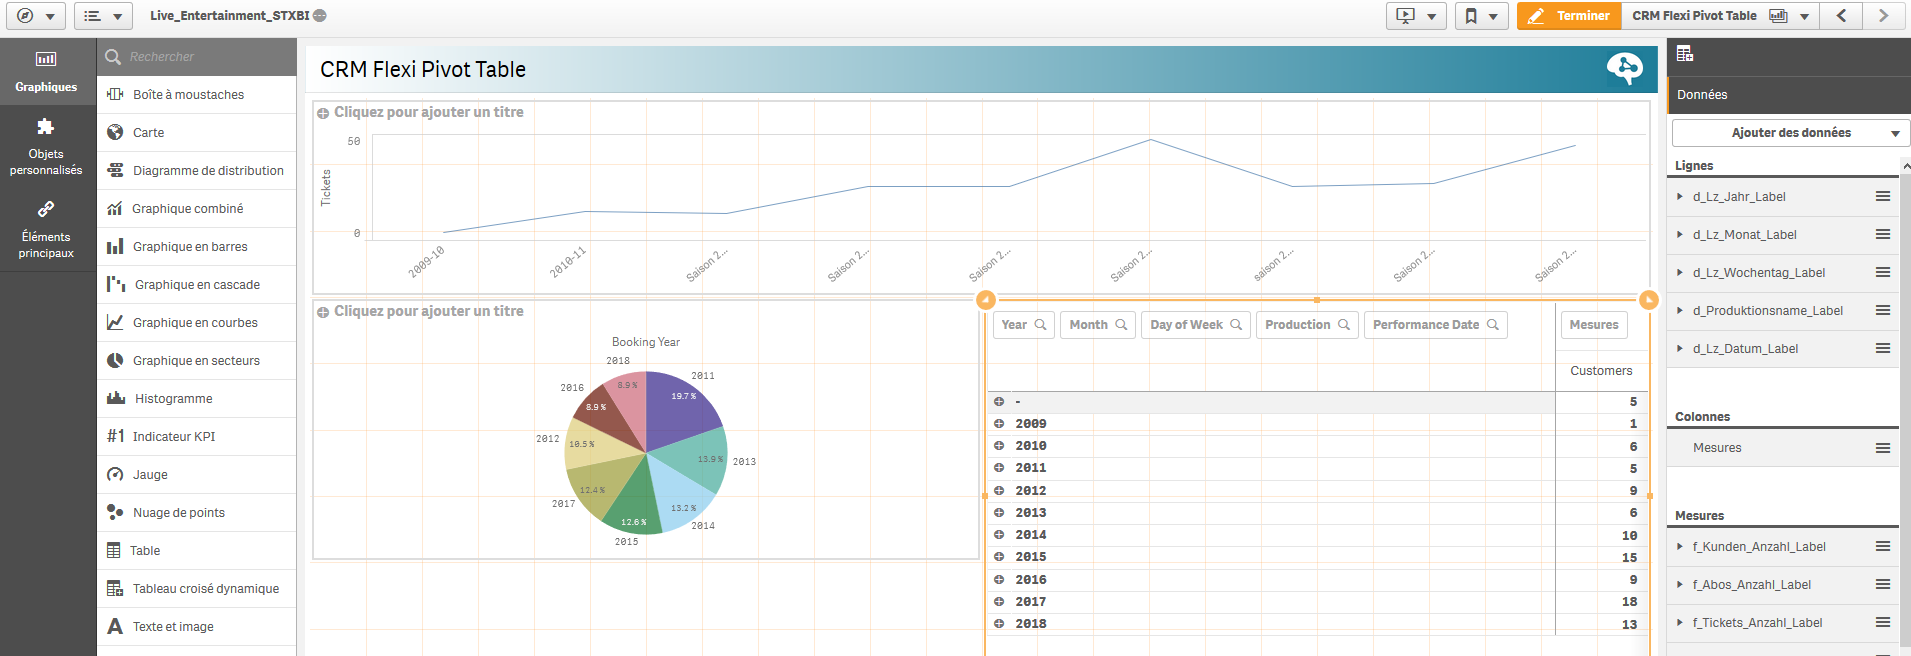
| CRM Flexi Pivot | Here you can build your own table, use the drag & drop of so called master dimensions. To use this feature, you have switch to the "modify" mode and duplicate the sheet. In the very left corner, dark grey area, you will find the master dimensions. Simply drag one of them into the table and use it as a dimension, or create a simple formula, using known arithmetic as sum, average, count. | ||||||
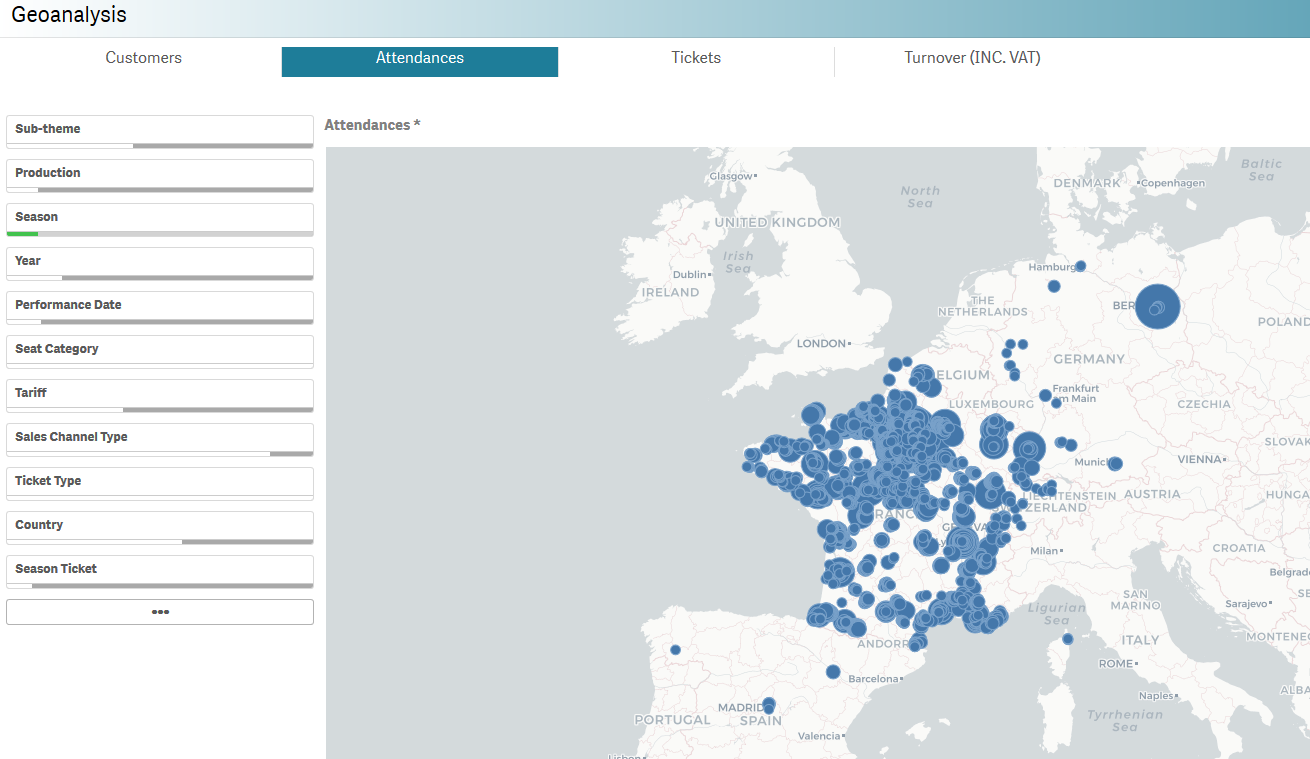
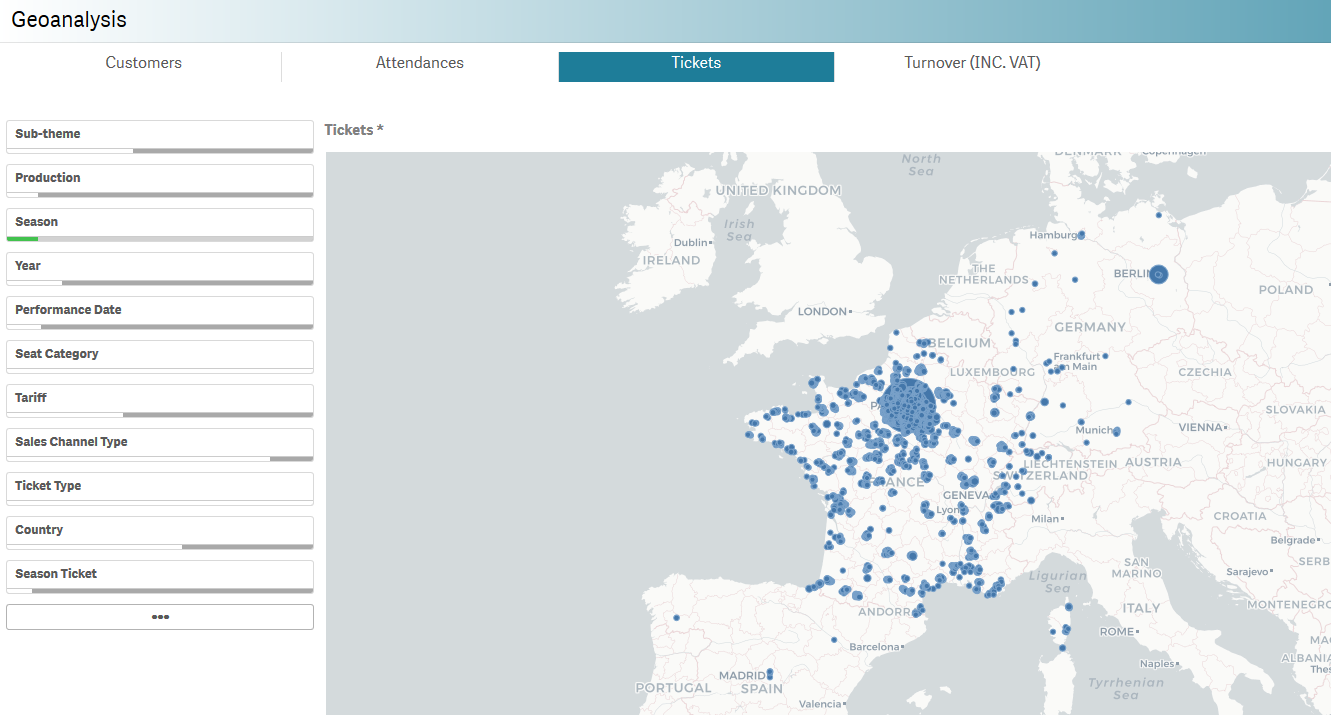
Géoanalyse | In this map, you can get a quick overview where your audience lives and which areas produce the most turnover or ticket sales. On the right side of the report you can quickly apply useful filters, such as Season or Sales channel.
| ||||||
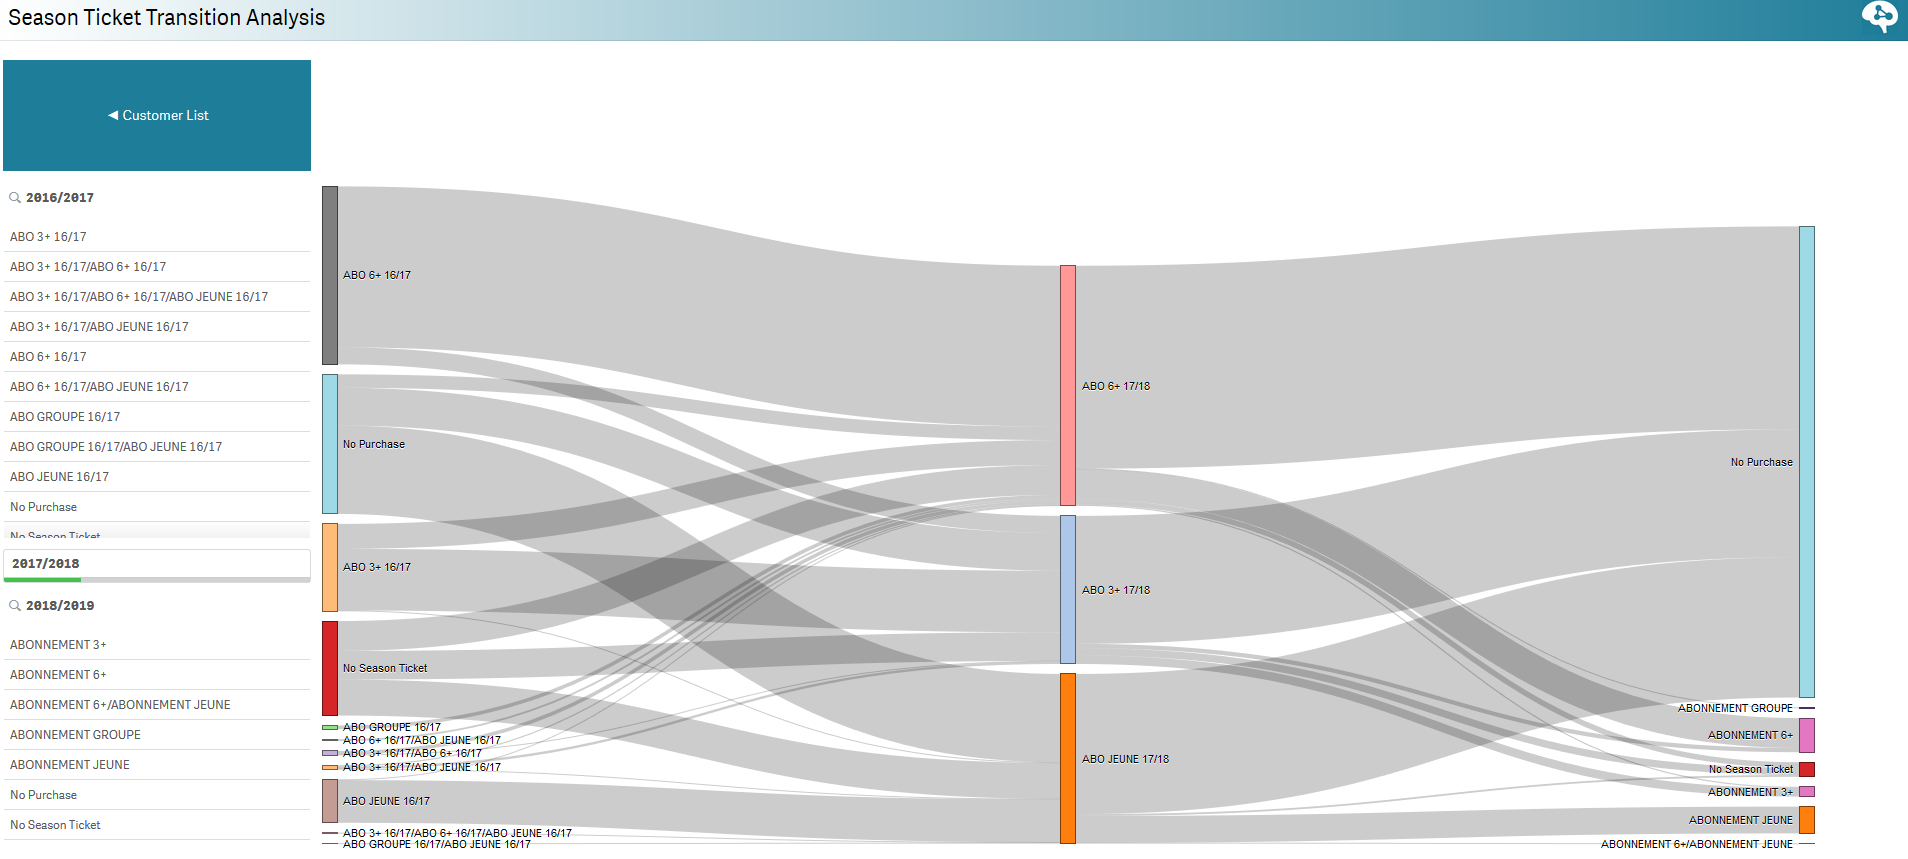
| Analyse abonnements inter-saison | This report shows you the flow of contacts who purchased a season tickets through several season. You can therefore check if your season tickets holders are new or loyal customers. |
...


