...
| Title | Description |
|---|---|
| Upcoming performances KPI | Key Performance Indicators (KPI) for the upcoming performances, i.e., based on the performance date:
Pivot table with the additional measures:
|
| Latest sales KPI | Key Performance Indicators (KPI) for the recent sales, i.e., based on the sales date: |
| Latest performances | |
| Latest events | |
| Event KPI | |
| Event weekday/month distribution | |
| Event utilization | |
| Latest sales per audience category | |
| Latest sales per performance | |
| Calendar view | |
| Year/season comparison | |
| Utilization per month | |
| Seat cat./contingent utilization matrix | |
| Sales potential per performance/seat cat. | |
| Configuration seat map | |
| Sales timeline seat map | |
| Venue utilization | |
| Seasonal utilization | |
| Event life cycle | |
| After event premiere | |
| Sales period | |
| Sales categorization relative to performance date | |
| Sales comparison relative to performance date | |
| Sales cross-distribution | |
| Sales Flexi Pivot Table | |
| Season ticket sales | |
| Season ticket sales per event/performance | |
| Season ticket sales date distribution | |
| Consumer behaviour 1 (Live Entertainment) | |
| Consumer behaviour 2 (Live Entertainment) | |
| Contact cross-distribution | |
| Ticket Resales |
...
| Title | Description | |
|---|---|---|
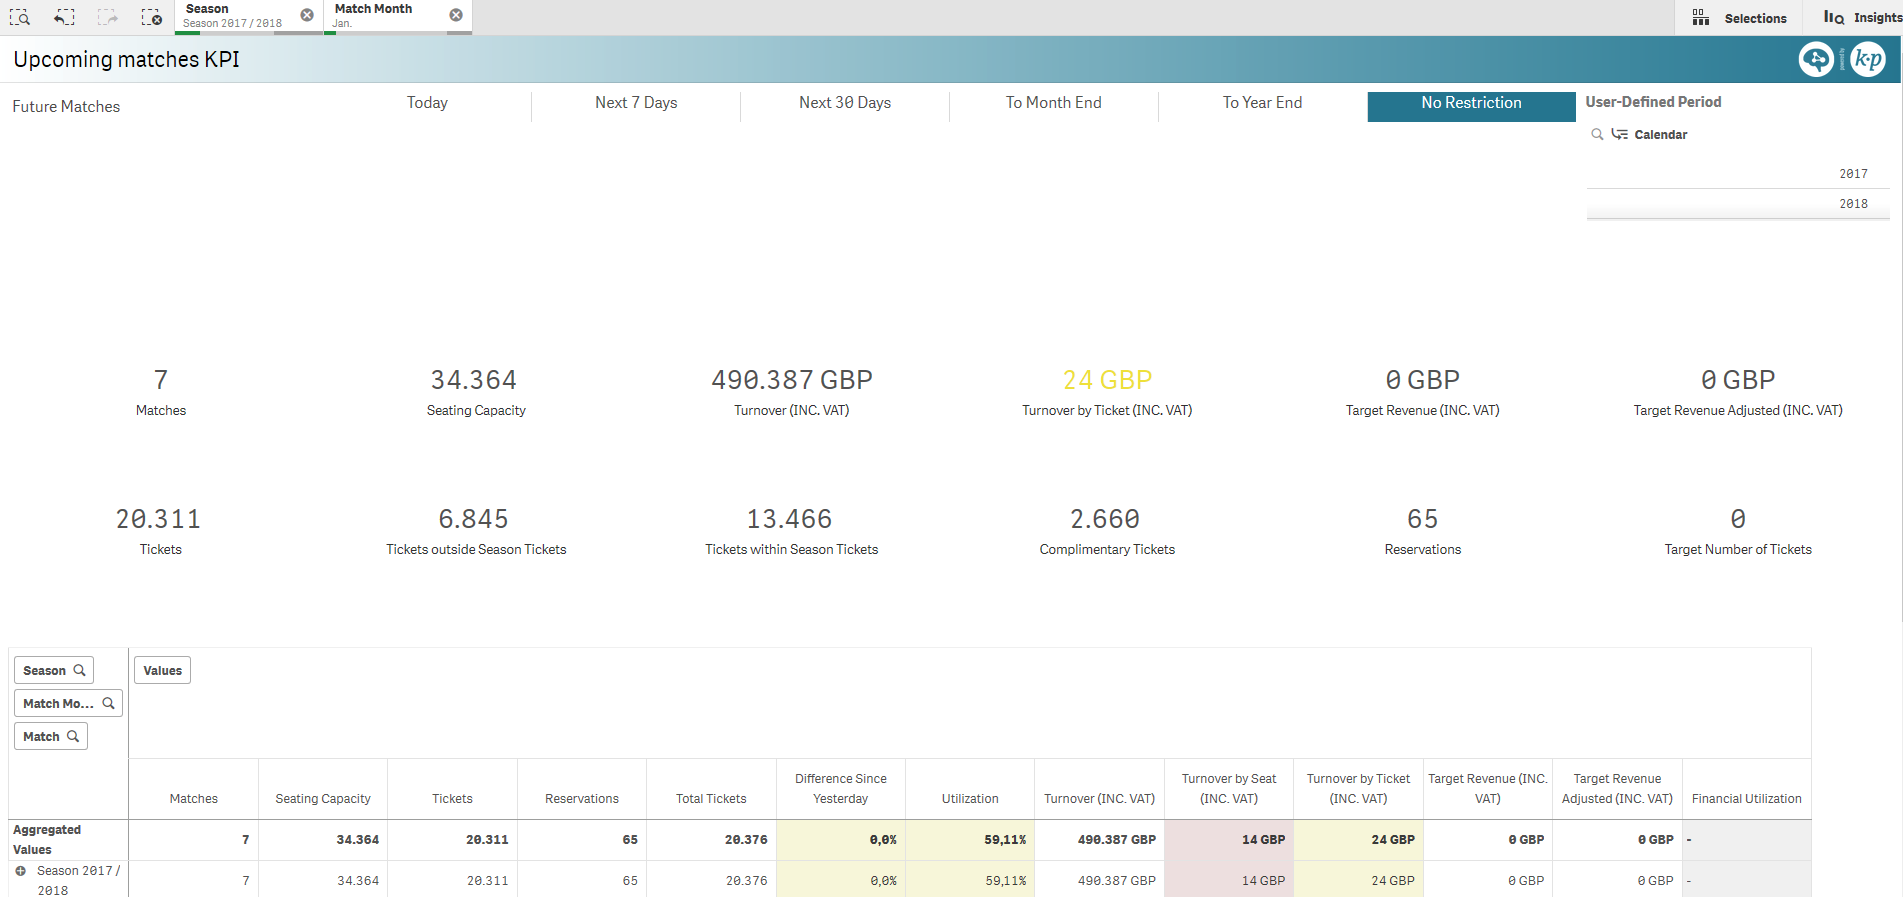
| Upcoming matches KPI | Key Performance Indicators (KPI) for the upcoming matches |
|
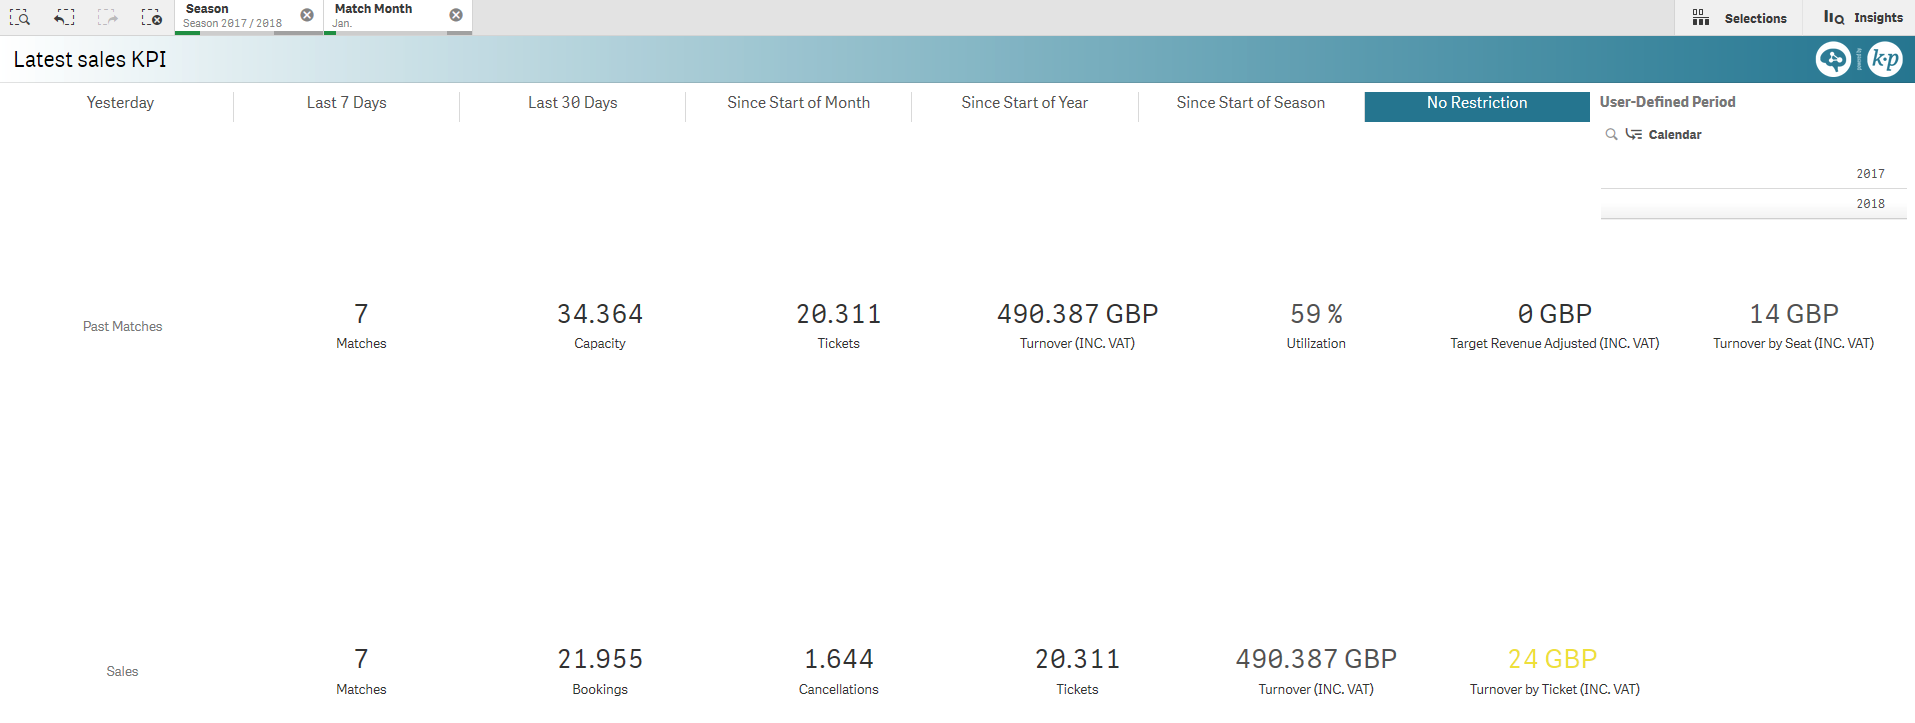
| Latest sales KPI | KPI for the latest sales, i.e, based on the sales date |
|
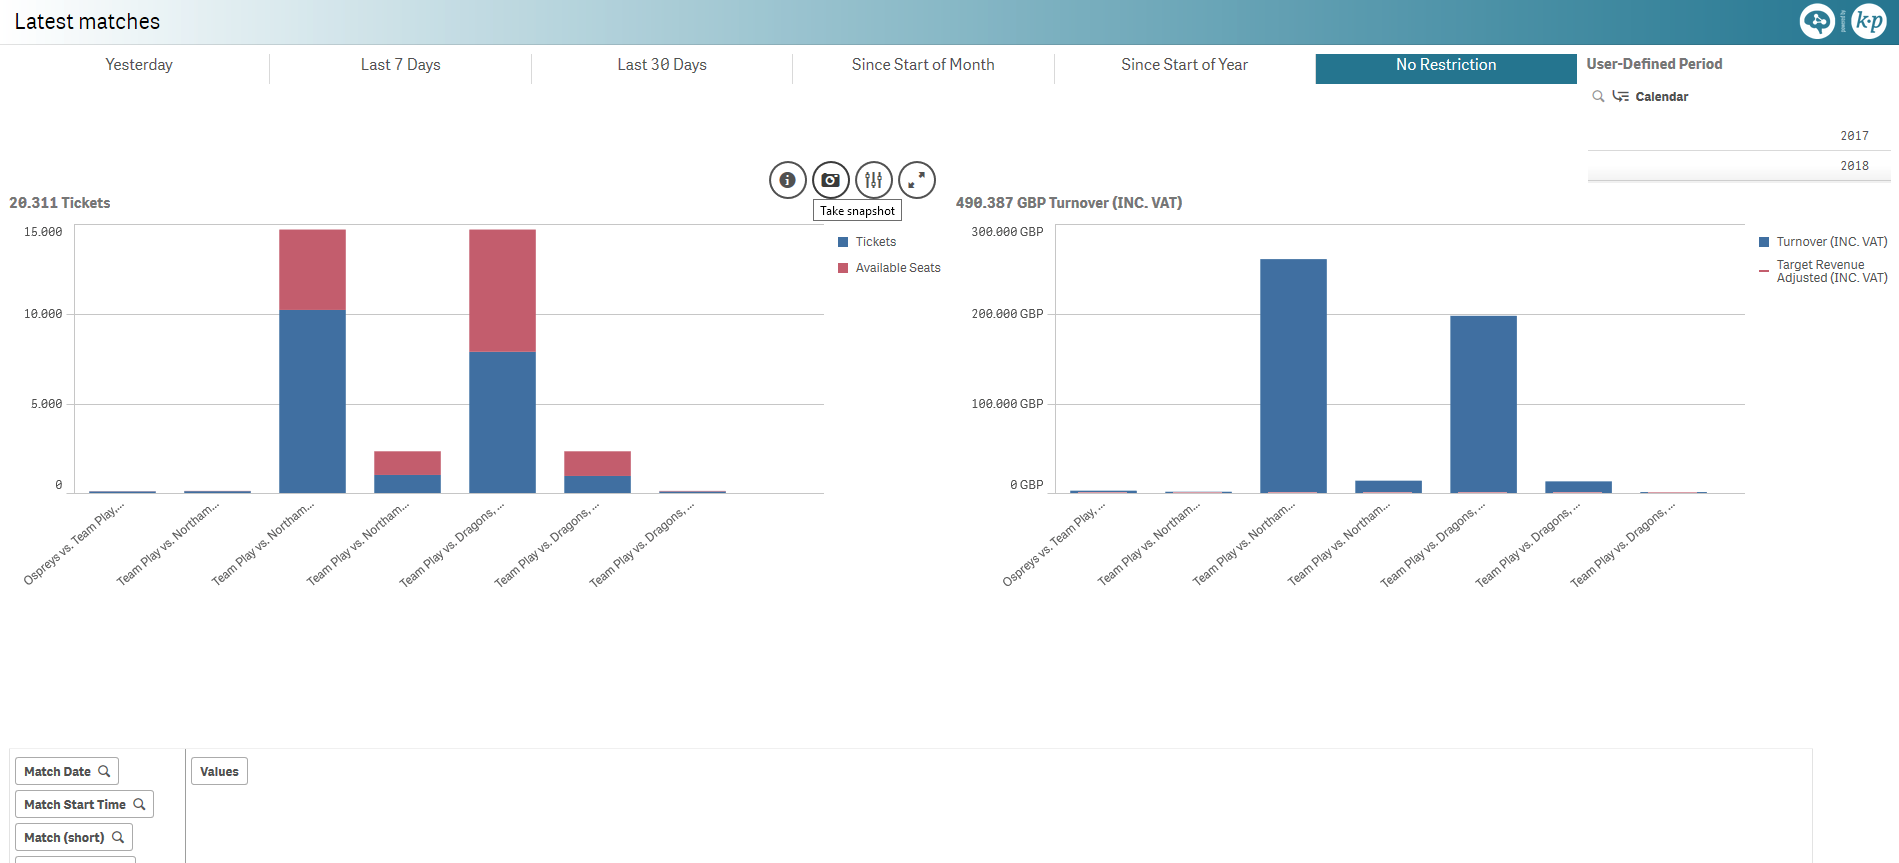
| Latest matches | Ticket and revenue charts for the latest matches with respect to the full quota and target revenue respectively. |
|
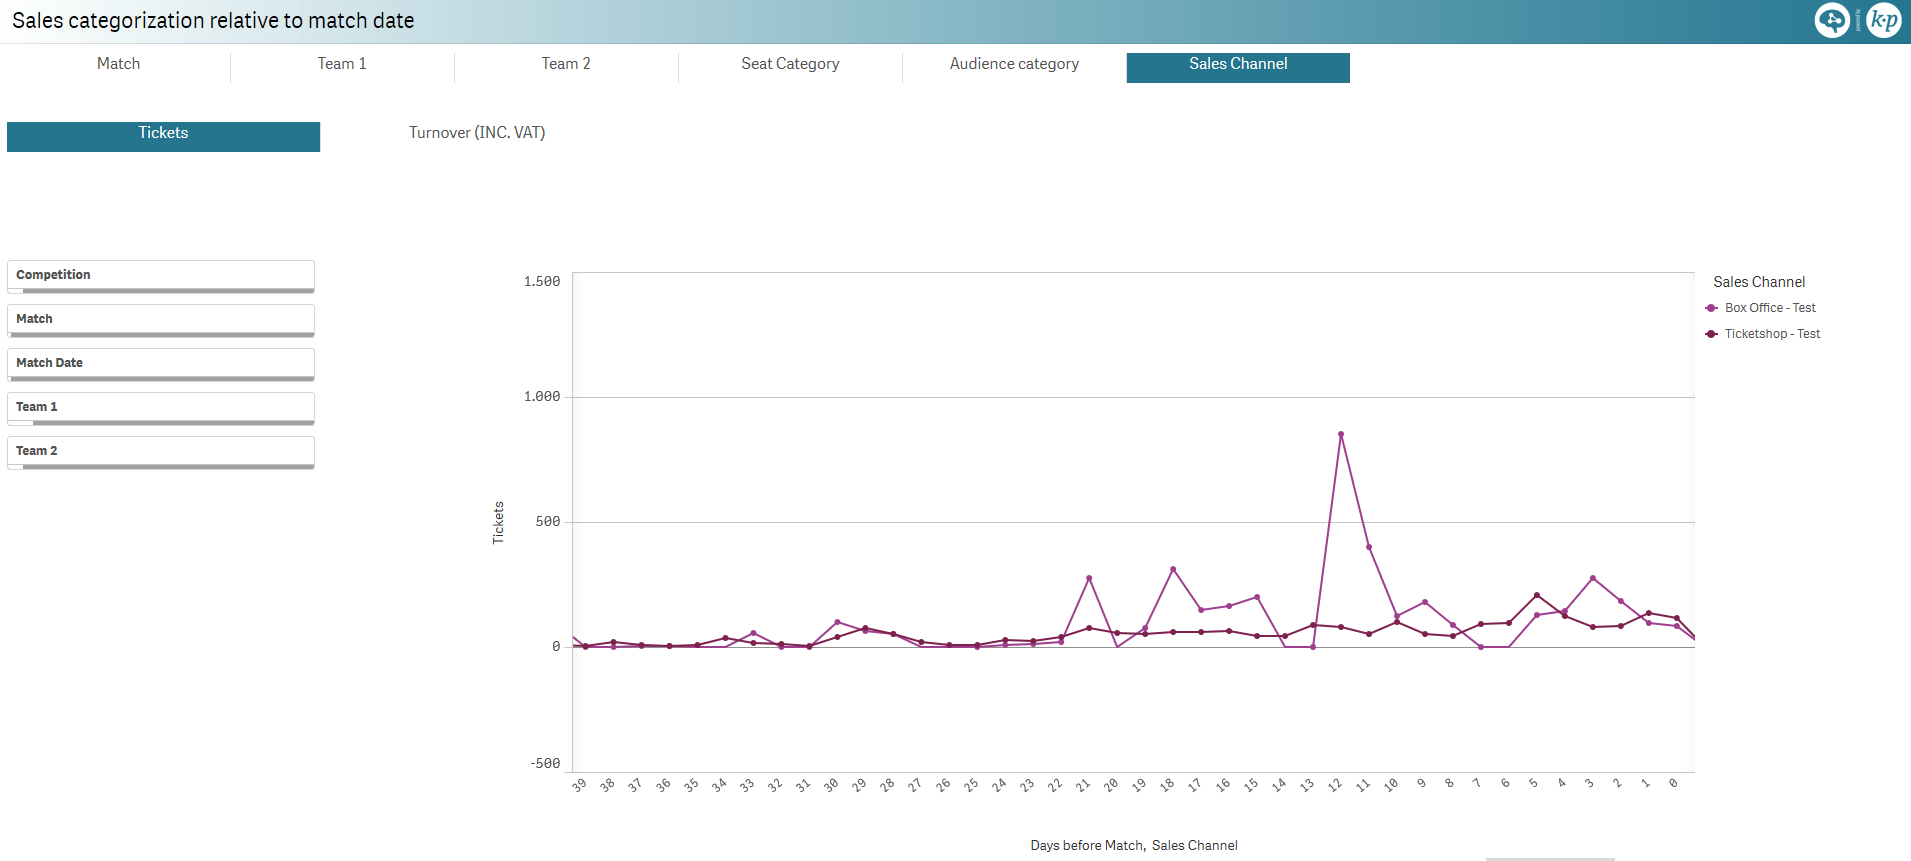
| Sales categorization relative to match date | Comparing ticket sales or revenue with respect to match date for the following dimensions:
Includes team logo display |
|
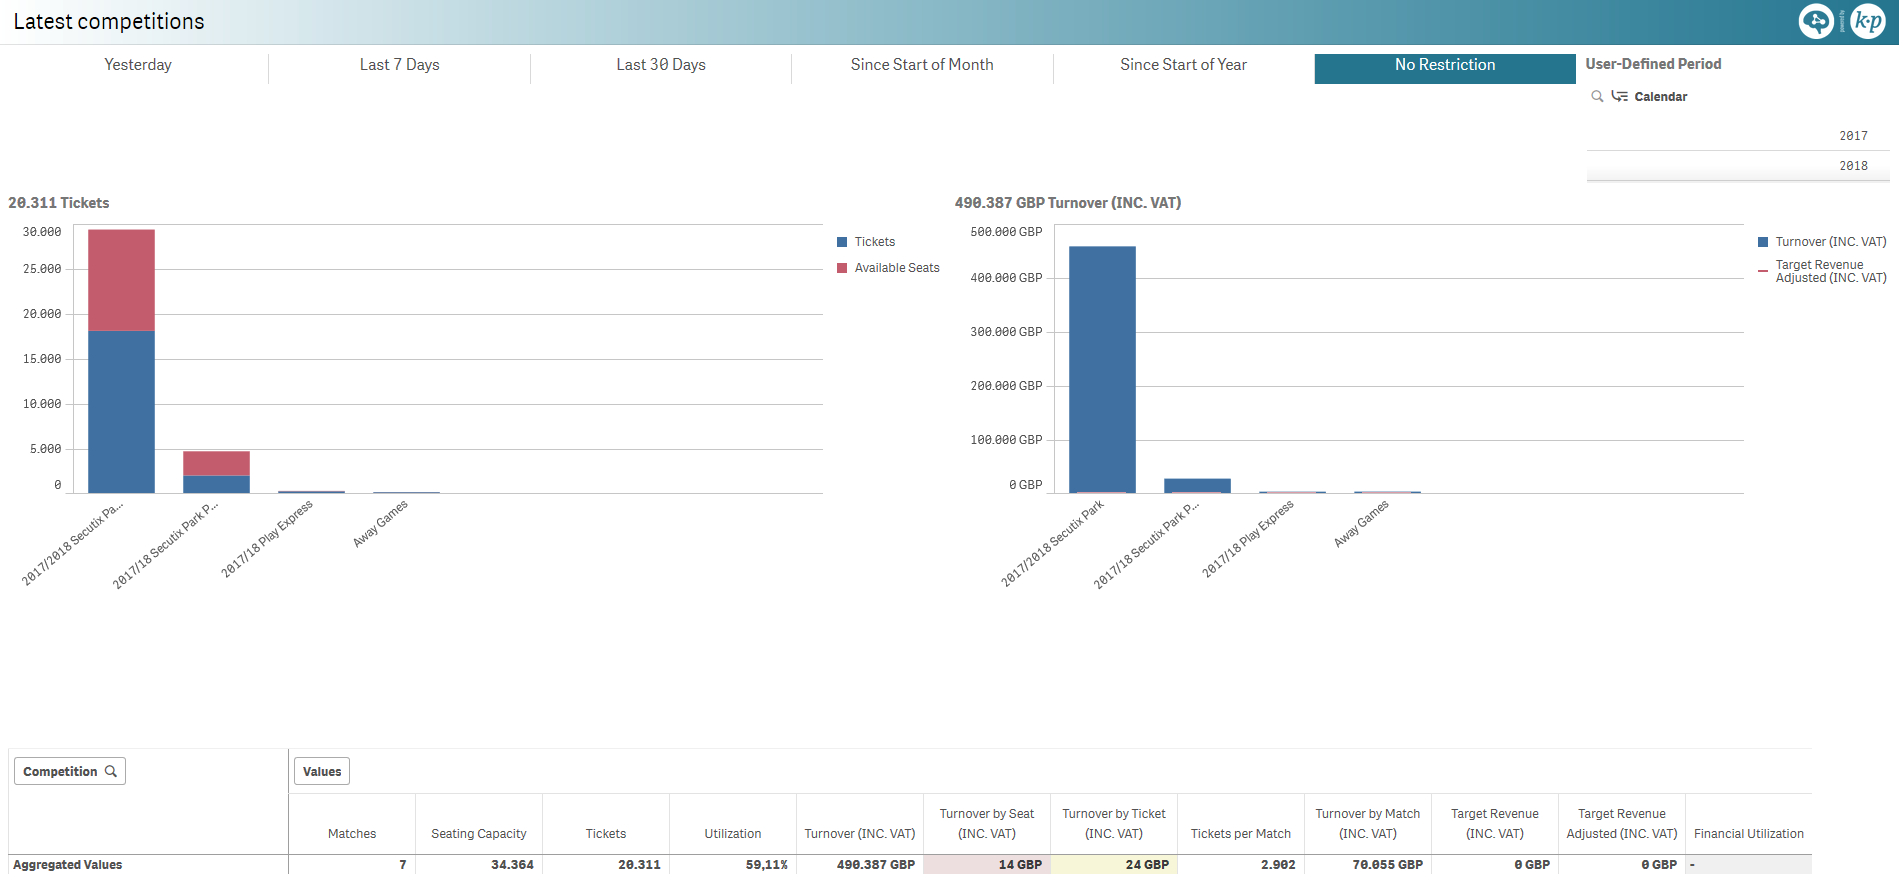
| Latest competitions | Ticket and revenue charts for the latest competitions with respect to the full quota and target revenue respectively |
|
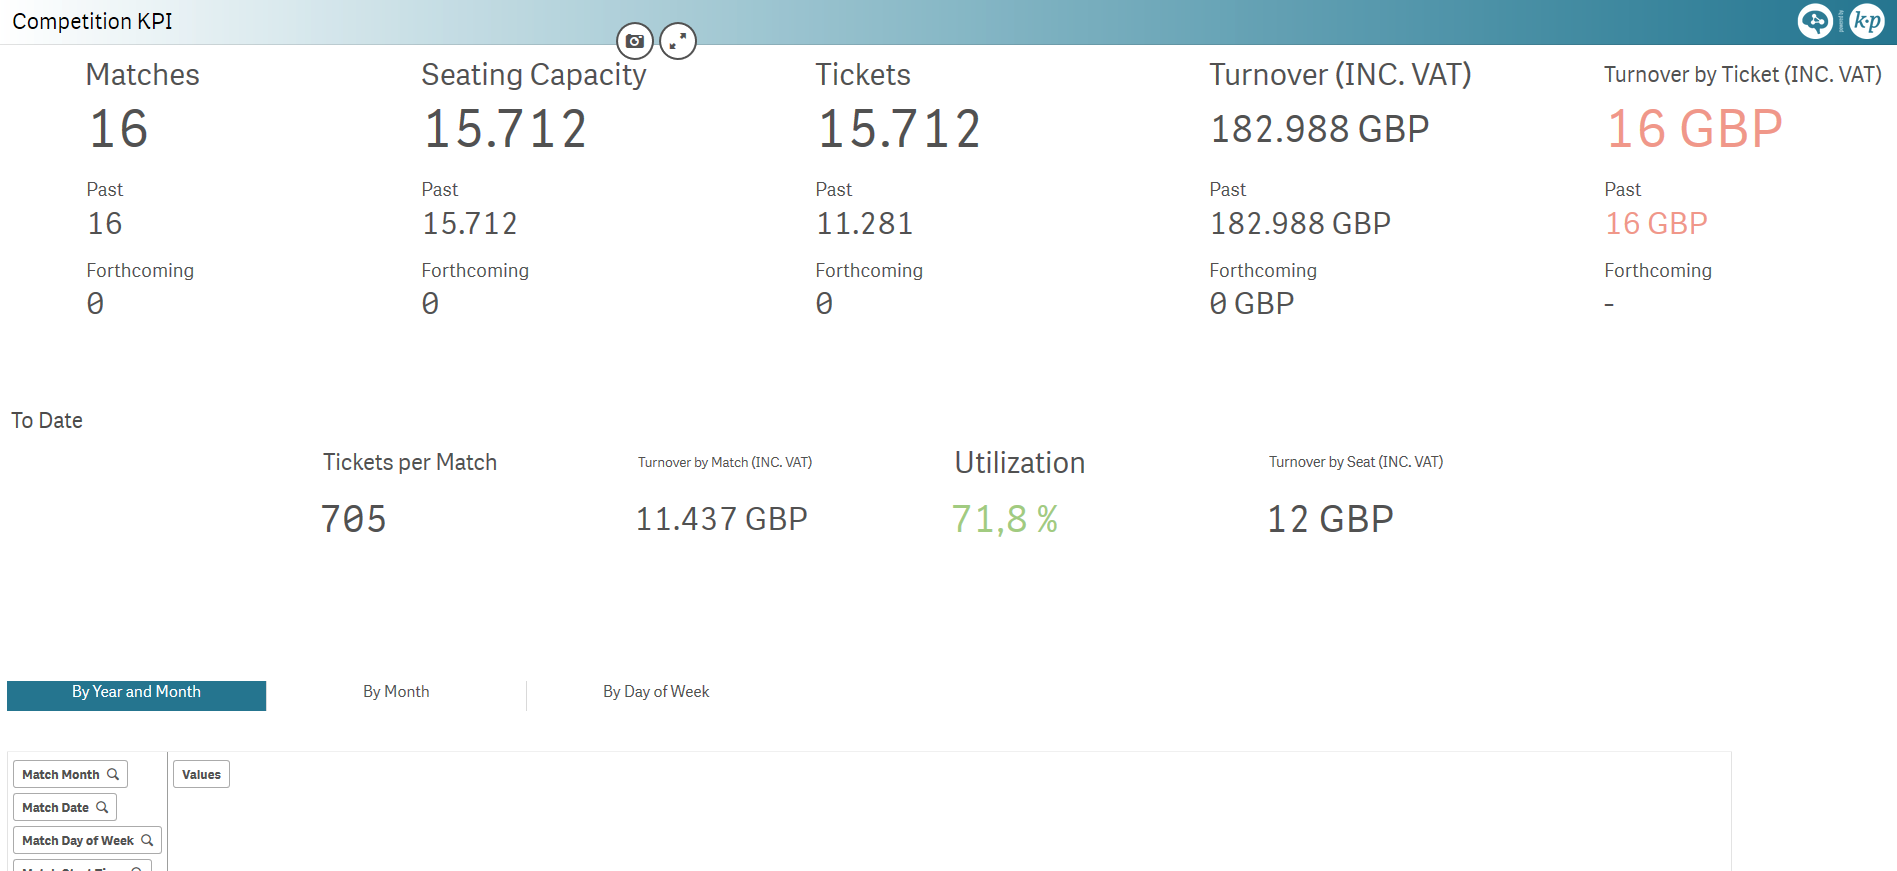
| Competition KPI | KPI for an ongoing competition, with a split on past and forthcoming matches:
and a view on the sales to date for the entire competition:
|
|
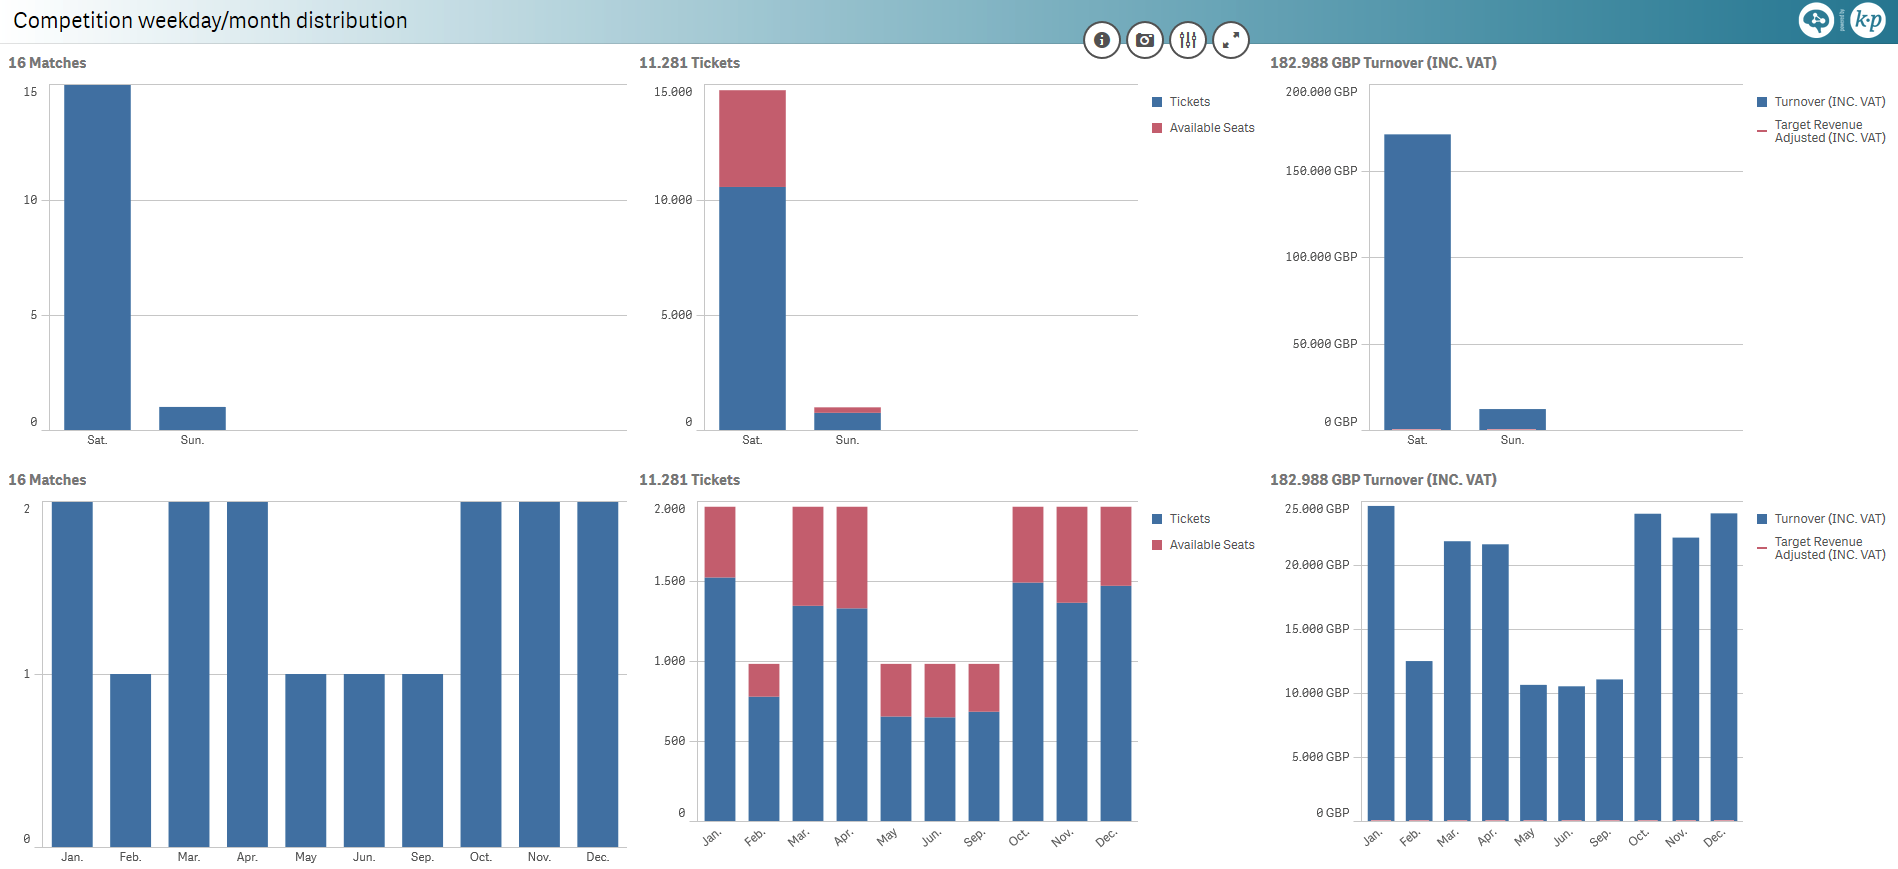
| Competition weekday/month distribution | Number of matches, sold tickets and revenue charts distributed over:
|
|
| Latest sales per audience category | ||
| Latest sales per match | ||
| Year/season comparison | ||
| Utilization per month | ||
| Sales potential per match/seat cat. | ||
| Configuration seat map | ||
| Sales timeline seat map | ||
| Venue utilization | ||
| Seasonal utilization | ||
| Competition life cycle | ||
| Sales period | ||
| Sales cross-distribution | ||
| Season ticket KPI | ||
| Season ticket per season | ||
| Season ticket sales period | ||
| Contact cross-distribution | ||
| Loyalty transition flow | ||
| Access control seat map | ||
| Access control timeline seat map | ||
| Access control time distribution | ||
| Customer knowledge seat map | ||
| Ticket Resales | ||
| Season Ticket Usage |
...